Graph of the week
Kudos to the paper Global scale assessment of urban precipitation anomalies (9/9/2024) for such an information dense yet understandable graph. The basic story is that cities are getting more precipitation. This is related to the heat island effect.
For the 271 cities with population more than 20,000, whose urban precipitation anomalies are significantly related to the urban heat islands in Fig. 4A, we find that for each one-degree increase in surface urban heat islands, there is 24.7 mm more annual precipitation in the urban precipitation anomalies. The larger the population, the larger the urban precipitation anomalies as well as the urban heat island (SI Appendix, Fig. S12).
Caption: Global urban annual precipitation anomalies. The urban annual precipitation anomalies according to continents and climate zones. (A) The color of the base map shows that the average of urban precipitation anomalies in the IPCC subregion is positive or negative. Each dot on the base map indicates one city, and the size and color of the dot describe the size and precipitation anomaly extent of the city. The pie charts show the percentage of cities with positive and negative (more or less precipitation over urban grids) urban precipitation anomalies in each continent (the pie charts for each IPCC subregion are shown in SI Appendix, Fig. S15). (B) The box plot for urban annual precipitation anomalies for cities in different climate zones. The numbers above the axis are the number of cities in that climate zone.
Really?
Massachusetts man buys $395,000 house despite warnings it will ‘fall into ocean’ (9/11/2024).
According to Bloomberg, Moot’s purchase of the home was 67% less than the seller’s $1.195m asking price in 2022. Speaking about his purchase of the home, which rests a mere 25ft from a sandy slope, Moot told the outlet: “Life’s too short, and I just said to myself, ‘Let’s just see what happens.’”
I suppose if you have the money to throw away, go ahead, recognizing that if it doesn’t fall into the ocean, it is going to be worth less every year. But also note that with all of these houses along the coast, someone is going to take the loss. The original sellers couldn’t even get half the asking price and the person who just bought it won’t get $395,000 when it sells next time.
Don’t believe every statistic
The title is all you really need here: No basis for claim that 80% of biodiversity is found in Indigenous territories (9/4/2024).
The 80% claim is based on two assumptions: that biodiversity can be divided into countable units, and that these can be mapped spatially at the global level. Neither feat is possible, despite important advances in measuring biodiversity3. In fact, according to the Convention on Biological Diversity — a multilateral treaty to develop strategies for the conservation and sustainable use of biological diversity, involving nearly 200 countries — biodiversity is the “diversity within species, between species and of ecosystems”4. It is not something that can be easily quantified.
What is interesting is how this 80% claim was repeated and how they try to identify the origin of the claim. In particular, notice the rise in those that repeated the claim with no source. Data rule alert: Doubt something everyone knows is true.
One source seems to be:
Three documents cite this publication, including a 2009 report by the Food and Agricultural Organization of the UN (FAO). It states: “Approximately 80 percent of the world’s remaining biodiversity is found in indigenous peoples’ territories.” But the encyclopedia actually asserts that “nearly 80% of the terrestrial ecoregions are inhabited by one or more indigenous peoples”. In other words, the original statement, along with the analysis underpinning it, merely quantified the proportion of the world’s 136 terrestrial ecoregions in which Indigenous Peoples were living.
Basically, this seems to be like the game of telephone with a dose of quantitative illiteracy.
Quick Science roundup
Transparent mice made with light-absorbing dye reveal organs at work (9/5/2024)
A dye that helps to give Doritos their orange hue can also turn mouse tissues transparent, researchers have found. Applying the dye to the skin of live mice allowed scientists to peer through tissues at the structures below, including blood vessels and internal organs. The method, described in Science on 6 September, could offer a less invasive way to monitor live animals used in medical research.
Maybe stop eating those Doritos.
Bumble bees lose their sense of smell after heat waves (8/27/2024)
In a study out today in the Proceedings of the Royal Society B, researchers show heat waves may severely jeopardize bumble bees’ ability to smell the flowers they feed on. The finding could foretell how climate change may affect the pollinators’ populations—and human industries that rely on them.
Education and DNA
Hat tip to Freddie deBoer’s post Education and Genes Grab Bag for pointing out the study Using DNA to Predict Education: a Meta-analytic Review (9/2/2024).
Our findings show that people’s genetic propensities for years spent in education predict their phenotypic differences in educational attainment and achievement, with large effect size that suggest substantial explanatory power and practical applications (Funder & Ozer, 2019). Indeed, the effect sizes of DNA-based predictions of educational attainment and achievement rival that of other predictors that have been previously extensively reported on, including children’s socioeconomic status (Selvitopu & Kaya, 2021) and their personality traits (Mammadov, 2021), teachers’ characteristics and expertise (Bardach et al., 2021), and school belonging and quality (Allen et al., 2018; von Stumm et al., 2020). Our meta-analytic results suggest that a SD increase in polygenic scores is associated with spending 1.08 more years in full-time education.
Caption: Polygenic score correlations with educational achievement across countries, ancestries, and birth years. Note: For legend, see Fig. 3. The size of triangles and circles that reflects sample size are scaled relative to each other; thus, the size of triangles and circles in Fig. 3 refers to samples ranging from N = 406 (FTP) to N = 217,550 (UK Biobank), and in Fig. 4 from N = 402 (MAUES) to N = 26,518 (MoBa)
deBoer’s article is worth reading and here is a good quote:
The most radical and destructive piece of educational policy in our country’s history, passed with remarkably broad bipartisan report, could only have been conceived of by those who believed that students have no intrinsic tendency towards a given performance level. And the result was disastrous - there was an immense waste of resources associated with NCLB, students and teachers and schools were suddenly forced to undertake inefficient and unnecessary census testing, and teacher tenure and unions were attacked. All because of a cheery and casually destructive insistence that every child was in possession of the same educational potential.
From my perspective in higher education, this notion that some/many? have that every college student can do anything is destructive. “Weeder” courses now have a negative connotation, yet letting a student know they aren’t likely to complete a major in the first year is one of the best things you can do for them. Otherwise, some students are left to pursue their unrealistic dream major and take on debt without anyone telling them that maybe their dream major isn’t for them. In the end, they don’t complete the major or are passed along yet would be better off in a different major or maybe not in college at all.
Let me emphasize that being academically smart doesn’t make one a better or more superior person, even if many of those with academic credentials act that way.
From the gardens


Higher education still losing ground
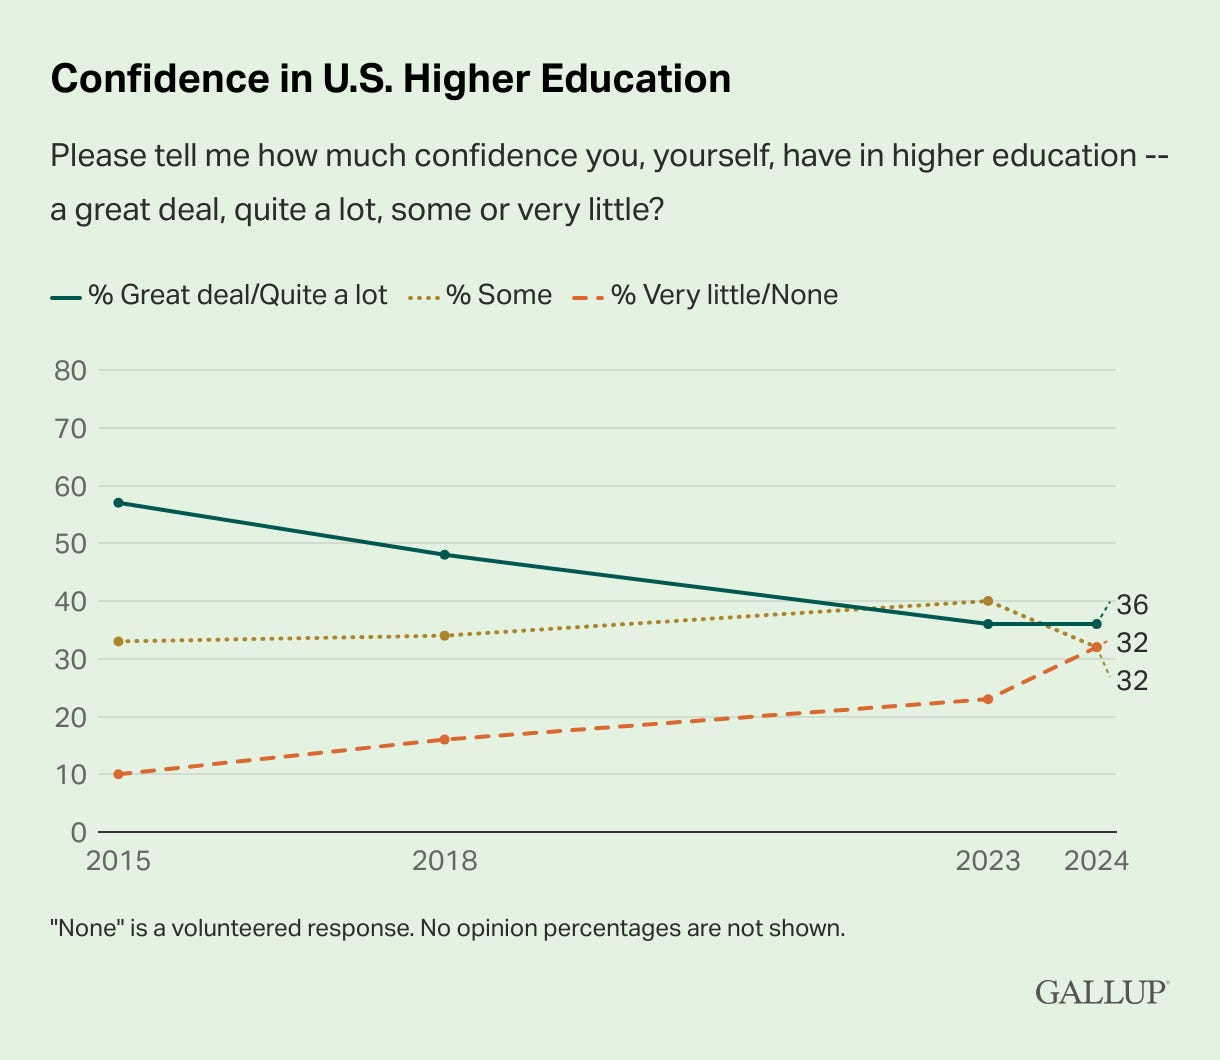
I must have missed this in July. The Gallup article U.S. Confidence in Higher Education Now Closely Divided (7/8/2024) has the graph below. The percentage of people that have a great deal or quite a lot of confidence in higher education stayed the same, but those with very little or none climbed 9 points to 32% while the some group dropped 8 points to 32% (I assume the missing percent is due to rounding).
U.S. productivity crushes Europe
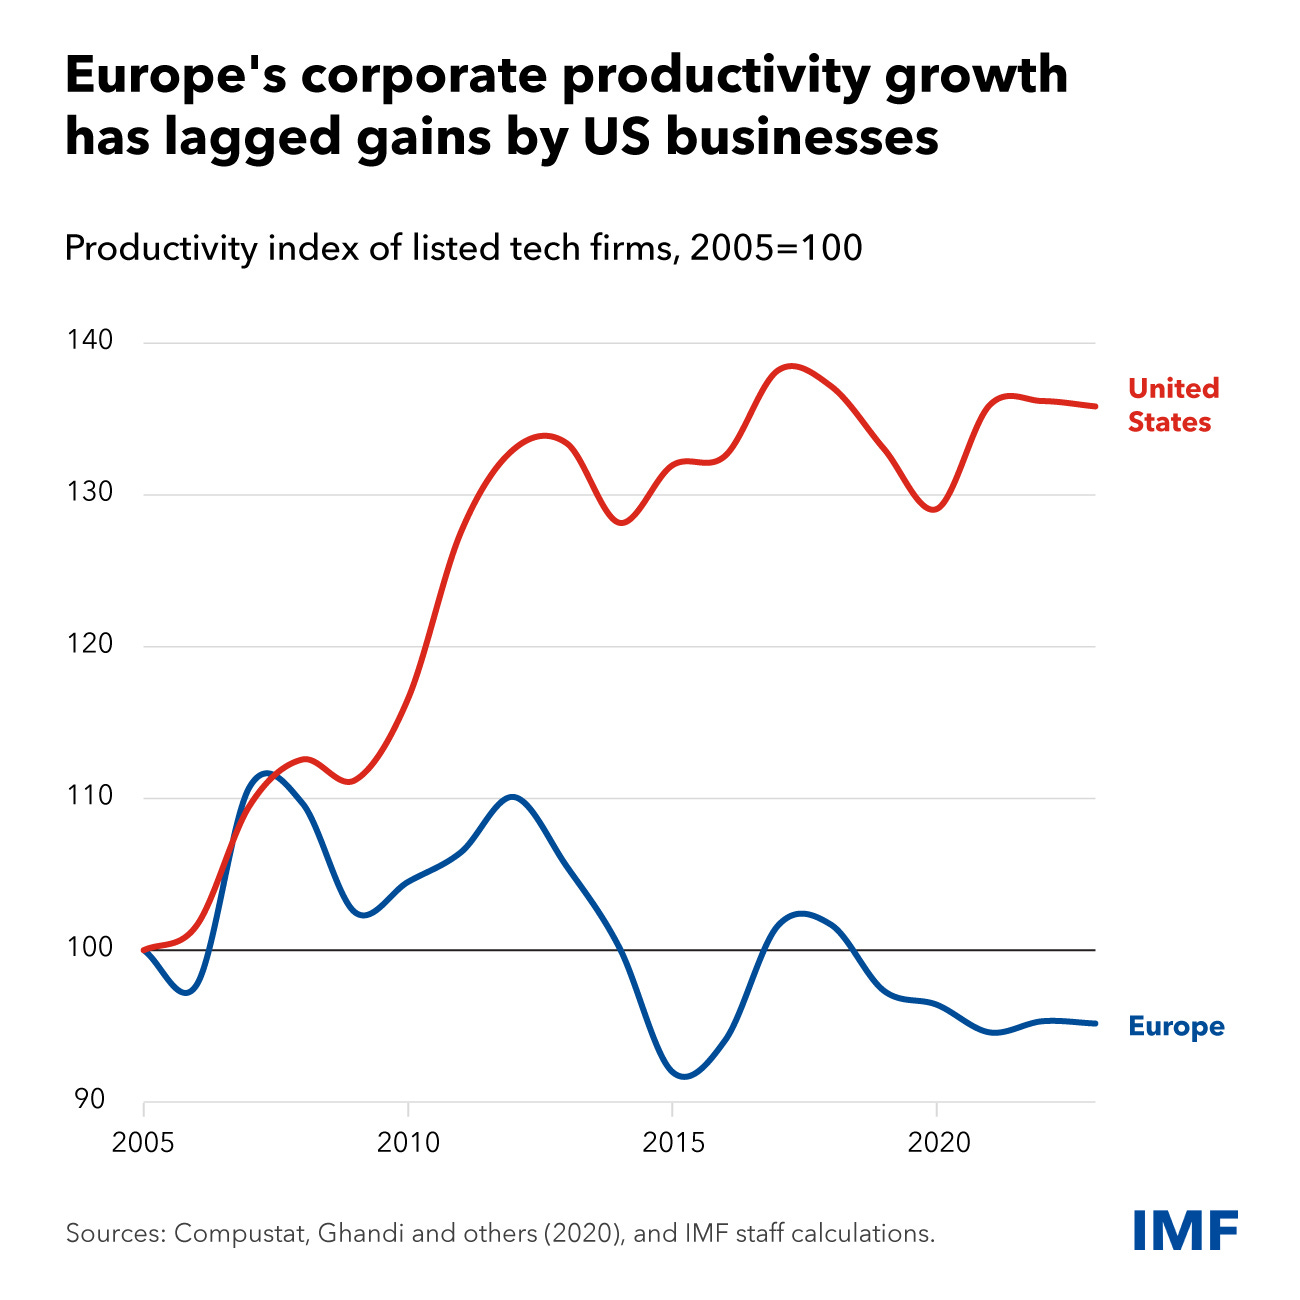
The IMF article How to Awaken Europe's Private Sector and Boost Economic Growth (9/11/2024) notes that productivity in the US has grown by almost 40% while Europe has been stagnant. Why?
In the United States, the fastest growing young companies employ six times more people (as share of total employment) than their European counterparts. With fewer successful young firms, there are also fewer large and highly productive companies later on. There is, instead, an overabundance of small and low-growth firms.
Data center update
Out goes the golf course; in comes a 343-acre data center (9/11/2024)
MNLCO Farmington, LLC & MNLCO Farmington Two, LLC have filed to rezone the Fountain Valley Golf Course and a neighboring property - totaling 343 acres - to MUCI (Mixed-Use Commercial/Industrial) in order to develop the data center park.
Battery storage
The EIA has this graph and headline on 9/5/2024:
The do note in the text that batteries aren’t a source of electricity, but the headline is still a bit misleading. It also isn’t clear how fast-growing is quantified. Ultimately, my main issue is lack of context and explanations. 20.7 GW of storage means that the batteries can produce 20.7 gigawatt hours for an hour or 10.353 gigawatt hours for 2 hours. According to a 2020 EIA article, electricity consumption in the U.S. varies during the day and for different months, but roughly the U.S. needs on average about 500 million kilowatthours continuously. A gigawatt hour is 1,000,000 kilowatt hours. In other words, we have enough battery storage to run 4% of the country for an hour. Battery storage has a long way to go to have an impact, and keep in mind that when the batteries run out, they have to be charged somehow.
The spinning CD
Please share and like
Sharing and liking posts attracts new readers and boosts algorithm performance. Everything you do is appreciated.
Comments
Please point out if you think something was expressed wrongly or misinterpreted. I'd rather know the truth and understand the world than be correct. I welcome comments and disagreement. We should all be forced to express our opinions and change our minds, but we should also know how to respectfully disagree and move on. Send me article ideas, feedback, or other thoughts at briefedbydata@substack.com.
Bio
I am a tenured mathematics professor at Ithaca College (PhD Math: Stochastic Processes, MS Applied Statistics, MS Math, BS Math, BS Exercise Science), and I consider myself an accidental academic (opinions are my own). I'm a gardener, drummer, rower, runner, inline skater, 46er, and R user. I’ve written the textbooks R for College Mathematics and Statistics and Applied Calculus with R. I welcome any collaborations.


