


A misleading NYT & Guardian graph
An animation to improve it

The NYT article See How 2023 Shattered Records to Become the Hottest Year (1/12/2024) has the graph below and states that “Global temperatures started blowing past records midyear.” We also have this quote (emphasis mine):
It comes as no surprise to climate scientists that unabated emissions of greenhouse gases caused global warming to reach new highs. What researchers are still trying to understand is whether 2023 foretells many more years in which heat records are not merely broken, but smashed. In other words, they are asking whether the numbers are a sign that the planet’s warming is accelerating.

Interestingly, they never say much about the graph. The color scheme isn’t great, as you can’t really tell the years apart. Ultimately, though, I think you are supposed to get the message about how crazy hot this year was with the orange line for 2023.
The Guardian has a similar graph in their article Temperatures 1.5C above pre-industrial era average for 12 months, data shows (7/7/2024), which is this:

This one is a little scarier, with the last year in red. They removed the color scheme for years, which is just as well. If you are a regular reader, you know I’m about to say ENSO. Before I get to the promised animation, two graphs first.
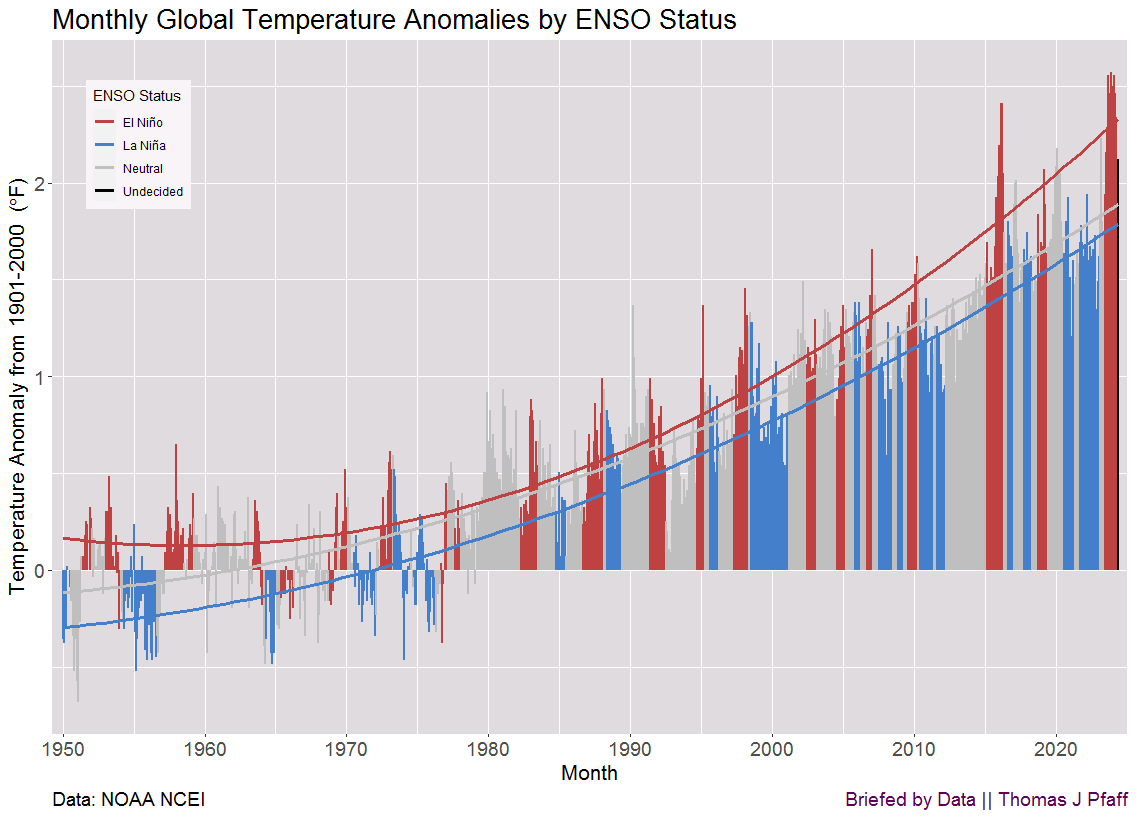
I update the monthly global temperature graph every month. In the NYT and Guardian graphs, the line at the top is the red El Niño. The anomalies for El Niño events are increasing faster than non-El Niño events, and overall, the trend is faster than linear; in other words, the planet is on average currently warming faster each year. This is also not the first time we’ve seen a temperature jump like this. In 2015–2016, you can also see a spike in anomalies, and we settled down until the current spike.
The line graphs by the NYT and the Guardian don’t capture this trend at all, and it is really hard to do in a static graph. Here is one where I label the years on the line and color the dots by ENSO status.

Yeah, it is a real mess, and because there is no order to the years, you can’t see any yearly trends associated with ENSO as you can with Figure 3. Years are shaded by grey scales, but it really doesn’t help much. If you really want to go with a line graph for this, which isn’t necessarily a good choice at all, it needs to be animated. Here it is, with the downside that you have to watch it a few times to pick up the trends and be patient with the speed. I kept it on the slow side so it could be studied.
What do we see? Overall, the lines are moving up the y-axis, meaning that the global temperature is warming. There are small El Niño jumps earlier in the graph, but it isn’t until 2015–2016 that we get a noticeable jump. In fact, those anomalies are about the same as we had this year in January through March. What we had this year was a late-in-the year El Niño jump that the NYT and the Guardian are emphasizing that is similar to the type of jump we saw at the end of 2015.
Two other key observations (please add your own in the comments). First, El Niño months are not the only months when records are set. This makes it clear that ENSO isn’t the only factor. The second thing we see is that record months and years where the yearly line sets a new record are typically followed by lower lines that fill in the gap between the new record and the previous data. I think of this as a jump-and-fill-in pattern. I don’t think Figure 5 is the best way to represent this data, as Figure 3 is what I think is currently best. My guess is that the NYT and Guardian, as well as other media, like the line graphs because the current year above the other years looks more dramatic.
What should we expect in the future? The space in Figure 4 between this last year and previous years will get filled in for the next few years. Sometime in the next 5 years, give or take, we will have another El Niño event that will smash current records because El Niño months are growing quadratically with more curvature than La Niña and neutral years.
One last note from the Guardian article:
From the Guardian: Even in a best-case scenario, he said, people need to prepare for a warmer world and “beef up” response plans. “Adaptation is not an admission that our current efforts are useless.”
Maybe they have been reading Briefed by Data and realize that we have to put some effort into adaptation. I am glad they are warming up to the idea.
Please share and like
Please help me find readers by forwarding this article to your friends (and even those who aren't your friends), sharing this post on social media, and clicking like. If you have any article ideas, feedback, or other views, please email me at briefedbydata@substack.com.
Thank you
In a crowded media market, it's hard to get people to read your work. I have a long way to go and I want to say thank you to everyone who has helped me find and attract subscribers.
Disagreeing and using comments
I'd rather know the truth and understand the world than always be right. I'm not writing to upset or antagonize anyone on purpose, though I guess that could happen. I welcome dissent and disagreement in the comments. We all should be forced to articulate our viewpoints and change our minds when we need to, but we should also know that we can respectfully disagree and move on. So, if you think something said is wrong or misrepresented, then please share your viewpoint in the comments.