Classroom Connections for January 6, 2024
Material for the curious and for possible use in a variety of math classrooms
Classroom connections are less something you can apply right away and more of me pointing out resources. I believe that there is a lot of amazing math, statistics, and data out there that might be used in math classrooms and is also interesting to the curious. Some of these examples may require some effort to be classroom-ready. Please let me know if you or someone you know uses any of this in the classroom or has a relevant idea (email me at thomas.pfaff@sustainabilitymath.org). Similarly, if you have an opinion or concept that is relevant, please share it in the comments. Because Substack claims you might not see the entire post in your inbox because it's too long, I'll add the buttons here. Please share, like, subscribe, and feel free to comment.
Inspiring video
Here is the abstract for this video:
The ability of the phenomenon of criticality to explain the sudden emergence of new properties in complex systems has fascinated scientists in recent decades. When systems are balanced at their “critical point,” small changes in individual units can trigger outsized events, just as falling pebbles can start an avalanche. That abrupt shift in behavior describes the phase changes of water from ice to liquid to gas, but it’s also relevant to many other situations, from flocks of starlings on the wing to stock market crashes. In the 1990s, the physicist Per Bak and other scientists suggested that the brain might be operating near its own critical point. Ever since then, neuroscientists have been searching for evidence of fractal patterns and power laws at work in the brain’s networks of neurons. What was once a fringe theory has begun to attract more mainstream attention, with researchers now hunting for mechanisms capable of tuning brains toward criticality.
I could see this being really useful for a high school classroom. Why learn math? Well, without it, you can’t do interesting stuff like this. Learning math is as much about, or really more about, doing interesting science as being a mathematician. Here is the related article in Quanta.
Sustainability, quantitative literacy, and statistics
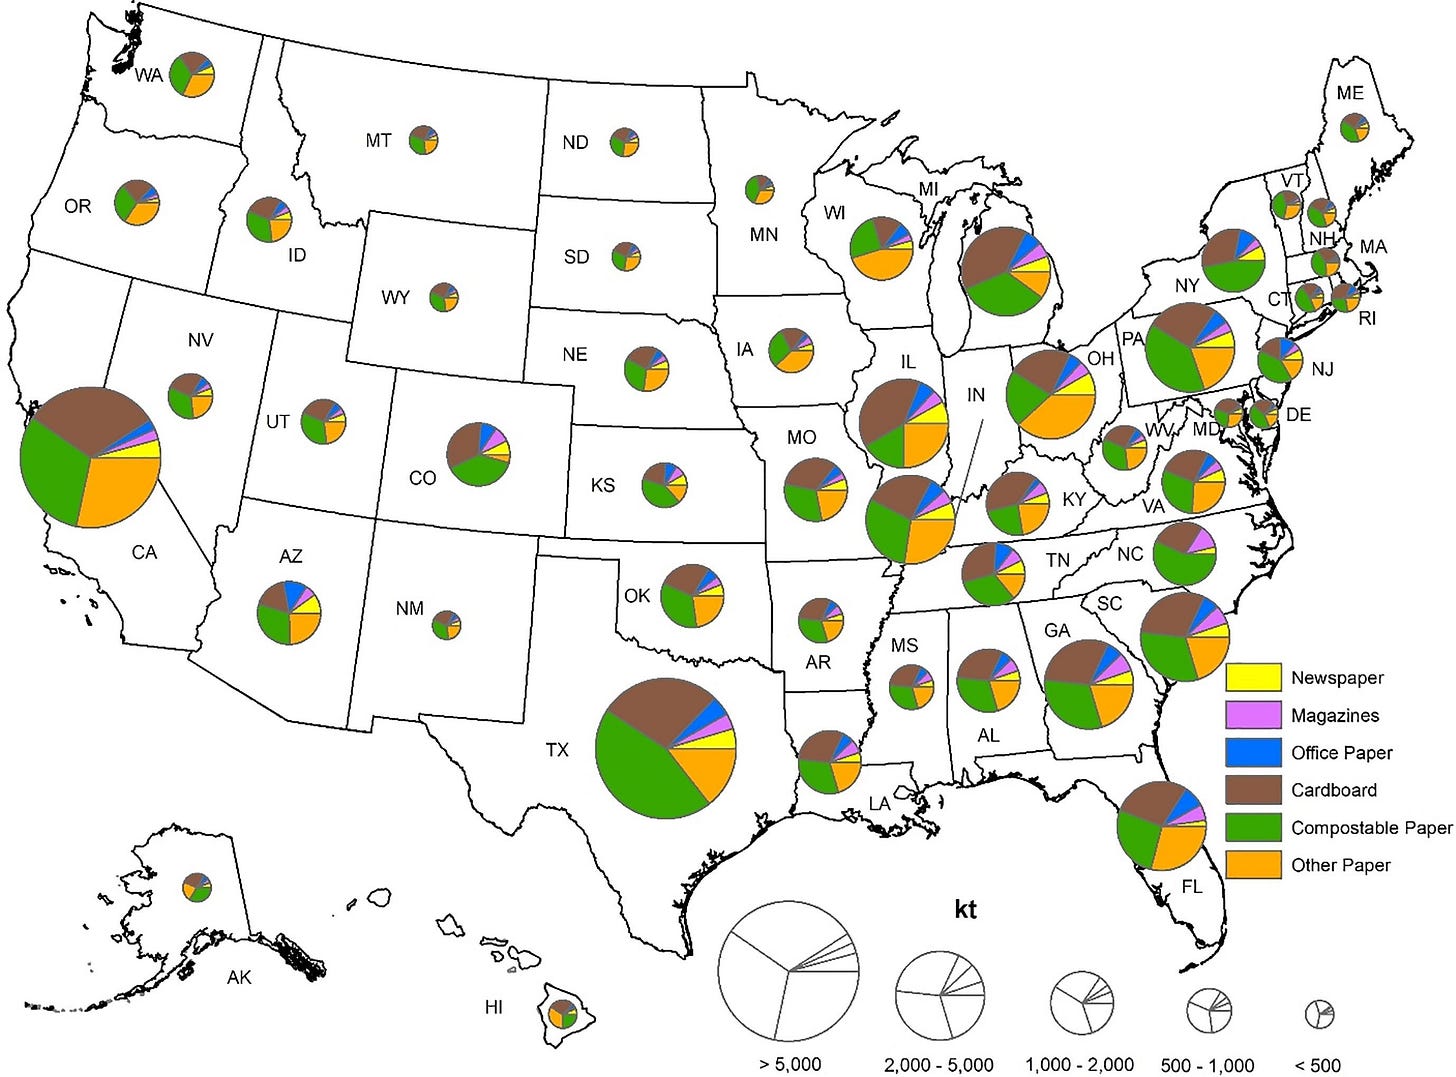
This comes from the paper Paper and cardboard waste in the United States: Geographic, market, and energy assessment (April 2024, officially). The paper has another map and a bar chart. There is a link to the data at the bottom, which could be used in statistics classes testing differences by region or red and blue states.
Interesting graph
If you just want an interesting graph to challenge students to decipher, here is one from Seasonal variation in dragonfly assemblage colouration suggests a link between thermal melanism and phenology (11/19/2023).
a, b Phenological fundamental tracking regulates species´ life cycles by synchronising them to optimal seasonal moments. a Fitness increases when the timing of phenological events aligns to the timing of ideal environmental conditions. b Phenological responses are triggered by environmental cues, such as certain photoperiod threshold (blue line), or combined photoperiod and temperature thresholds (brown line). These environmental cues link to—unknown—underlying drivers of optimal timing (a and b adapted from11). c Example of the life cycle of the dragonfly Sympetrum striolatum which is regulated by seasonal environmental conditions. Arrows note phenological events triggered by environmental cues. Eggs are oviposited in October when cold temperatures induce a diapause in their embryonic development that lasts until spring, when development resumes triggered by photoperiod and temperature cues74. Larvae hatch and develop for two to four months, depending on water temperature. Last instar larvae emerge, again triggered by photoperiod and temperature cues. Adult complete maturation and reproduce74. Alternatively, if oviposition occurs earlier, eggs can develop without diapause and larvae hatch in autumn to enter a diapause that lasts until spring, when development resumes74. Other temperate odonates have different life cycles varying in length from less than a year to several years74, most of which are regulated by phenological fundamental tracking. d 5th and 95th percentile of dragonfly and damselfly flight periods in Great Britain, together with variation in radiation (orange) and temperature (blue) across the season (upper panel), indicated as standard deviation from the cross-year average (grey dashed line). Coenagrion scitulum is not shown because its rarity in the study system does not allow to derive a representative flight period. Artwork in (c) by Zijing Deng.
Venn diagram
Who knew people used Venn diagrams? Here is one from the paper Bee species richness through time in an urbanizing landscape of the southeastern United States (12/11/2023). The paper is also interesting, but I’m thinking some folks can make use of the Venn diagram here and maybe the rest of this graph.

Probability and wordle
There is not much in the way of charts in Have I Been Cheating at Wordle? (12/21/2023), but there is some nice basic probability that could be used in a classroom.
If you just look at the 5-day streak and multiply the chances of getting the score-or-better, the odds of it would seem to be
which is about 67,500-to-1 against. Throw in the other eagle (and never mind that I also scored 2 on Nov. 30), and multiplying another makes it longer than a million-to-one shot. Surely cheating beyond reasonable doubt?
ANOVA and t-tests
I used this graph in Thursday’s Quick Takes and Random Stuff from the article Democrats are better than Republicans at discerning true and false news but do not have better metacognitive awareness (11/18/2023). The article reports results from ANOVA and t-tests. There is a link to the data at the bottom of the article.
Rate of change for calculus
There are also graphs and statistics, but rates of change in context can be helpful for calculus courses. This is from Climate change exacerbates nutrient disparities from seafood (10/20/2023).
Our projected declines in nutrient availability from fisheries and mariculture scale significantly and linearly with levels of atmospheric surface warming (Fig. 4, p < 0.05 and Methods). Globally, seafood-sourced nutrient availability is projected to decrease at a rate of 3.1–6.5% per degree Celsius of warming relative to pre-industrial levels (Fig. 4a,c,e,g). Among the four studied nutrients, the availability of calcium from fisheries and mariculture production is most sensitive to global warming (6.5 ± 0.2% standard error (s.e.) per degree Celsius of warming). However, for lower-income countries (below median GDP per capita globally; Fig. 3b) the rate of decline in nutrient availability per unit of warming is two to three times the global average (9.7–11.6% per degree Celsius of warming, Fig. 4).
Applied vector field
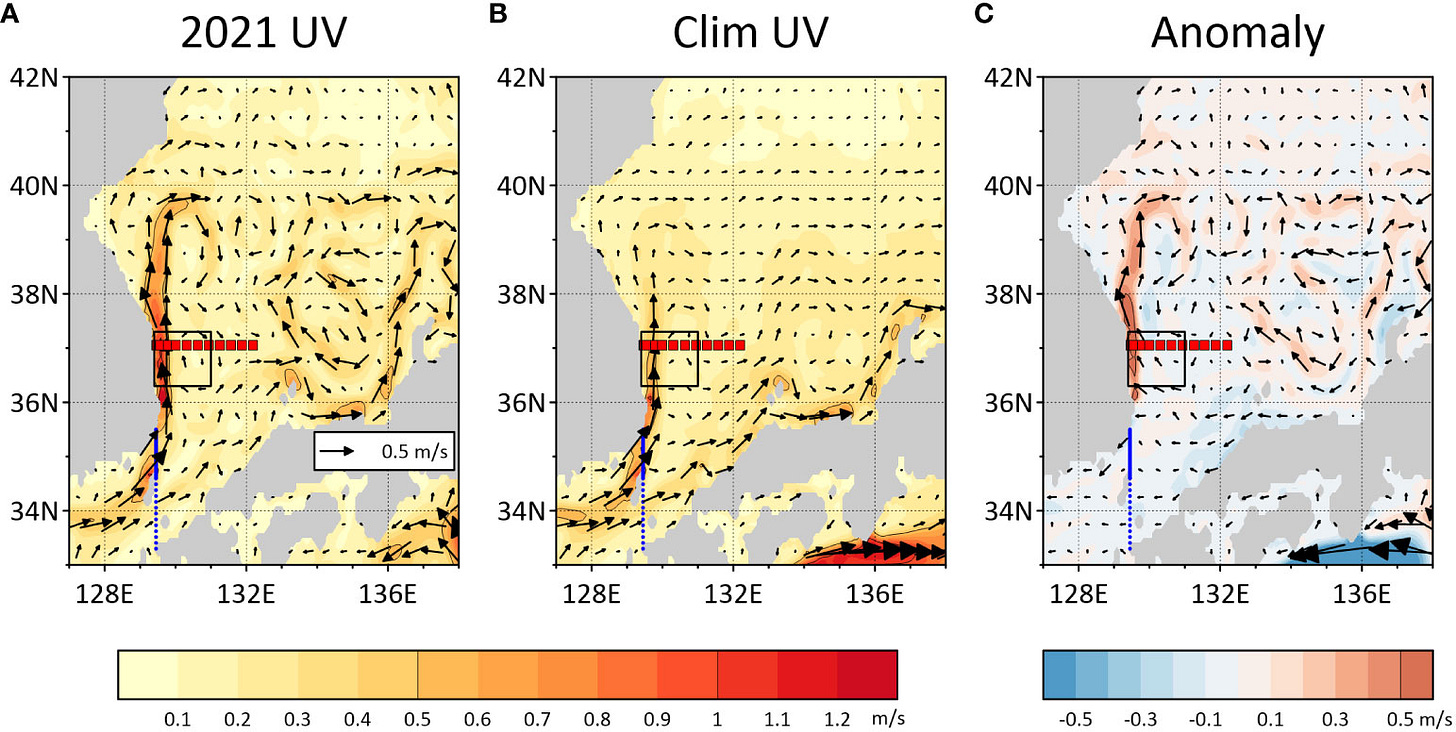
Here is an example of a vector field from the paper Quantification of the extremely intensified East Korea Warm Current in the summer of 2021: offshore and coastal variabilities (11/23/2023). This is a great example to use when teaching differential equations.
Here is a look at the model.
Conditional probability
This screen shot is from Understanding the Contributions of Paleo-Informed Natural Variability and Climate Changes to Hydroclimate Extremes in the San Joaquin Valley of California (11/13/2023). If nothing else, just showing students these examples can be helpful.
PCA and k-means
From Exploring the diversity and genetic structure of the U.S. National Cultivated Strawberry Collection (5/26/2022), we have this graph.

The data is available at the end of the article.
Free from PRIMUS
PRIMUS (Problems, Resources, and Issues in Mathematics Undergraduate Studies) is a peer-reviewed journal (I’m the stats and data science subject editor). Every year, it makes some articles freely available.
Please share and like
Please help me find readers by forwarding this article to your friends (and even those who aren't your friends), sharing this post on social media, and clicking like. If you're on Twitter, you can find me at BriefedByData. If you have any article ideas, feedback, or other views, please email me at briefedbydata@substack.com.
Thank you
In a crowded media market, it's hard to get people to read your work. I have a long way to go, and I want to say thank you to everyone who has helped me find and attract subscribers.
Disagreeing and using comments
I'd rather know the truth and understand the world than always be right. I'm not writing to upset or antagonize anyone on purpose, though I guess that could happen. I welcome dissent and disagreement in the comments. We all should be forced to articulate our viewpoints and change our minds when we need to, but we should also know that we can respectfully disagree and move on. So, if you think something said is wrong or misrepresented, then please share your viewpoint in the comments.


