


Classroom connections November 21, 2024
Content ideas and data for math and statistics classes

Classroom connections are less something you can apply right away and more of me pointing out resources. I believe that there is a lot of amazing math, statistics, and data out there that might be used in math classrooms and is also interesting to the curious. At the same time, the next time someone asks what math is used for, well, here are a bunch of examples.
Some of these examples may require some effort to be classroom-ready, and some of this has appeared in previous posts. I’m ordering this roughly based on the level of math. Please let me know if you or someone you know uses any of this in the classroom or has a relevant idea (email me at thomas.pfaff@sustainabilitymath.org). Really, leave a comment (if nothing else, comments are encouragement for me to keep doing this) or send me an email if these classroom connection posts are useful. Similarly, if you have an opinion or concept that is relevant, please share it in the comments. Please share, like, subscribe, and feel free to comment.
Data, graphs, modeling —population pyramids
Population Momentum and Fertility (Jan 2024, pdf file) is a report from the U.S. Census Bureau and has numerous population pyramids under different scenarios. These are excellent for talking about population modeling.

The paper also has the math for population momentum. Here is a peak.

An abundance of confidence intervals and p-values
If you just want to give students confidence intervals or p-values to interpret, then check out Sex Differences in Cardiovascular Outcomes in Patients With Kidney Failure (5/3/2024). Here is just one example. This paper was highlighted in QTRS 11/7/2024.

Good statistics study and ideas for project
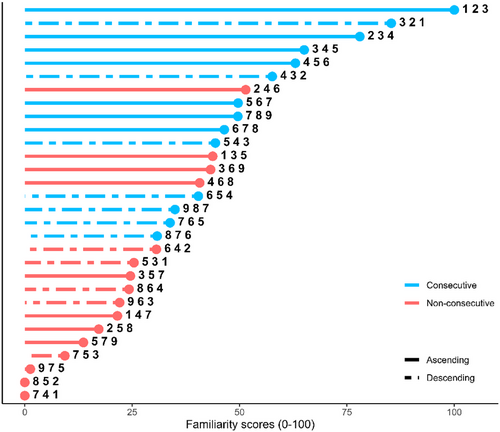
The paper Familiar Sequences Are Processed Faster Than Unfamiliar Sequences, Even When They Do Not Match the Count-List (7/9/2024) is a nice understandable study. The results are interesting to math, and the paper could be used in a statistics class either to talk about or to generate ideas for a project. This was highlighted in QTRS 8/1/2024.
In order processing, consecutive sequences (e.g., 1-2-3) are generally processed faster than nonconsecutive sequences (e.g., 1-3-5) (also referred to as the reverse distance effect). A common explanation for this effect is that order processing operates via a memory-based associative mechanism whereby consecutive sequences are processed faster because they are more familiar and thus more easily retrieved from memory. Conflicting with this proposal, however, is the finding that this effect is often absent. A possible explanation for these absences is that familiarity may vary both within and across sequence types; therefore, not all consecutive sequences are necessarily more familiar than all nonconsecutive sequences.
Useful data
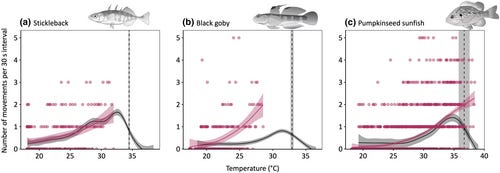
It seems that the data here, Global change and premature hatching of aquatic embryos (9/5/2024), could be useful for more basic statistical tests if not for the models they did. They provide links to the data at the bottom.
Regression
There are links to the data in the paper Normalized difference vegetation index analysis reveals increase of biomass production and stability during the conversion from conventional to organic farming (8/28/2024), so you could reproduce all of these regressions or just ask students to interpret them.

Hierarchical clustering and more
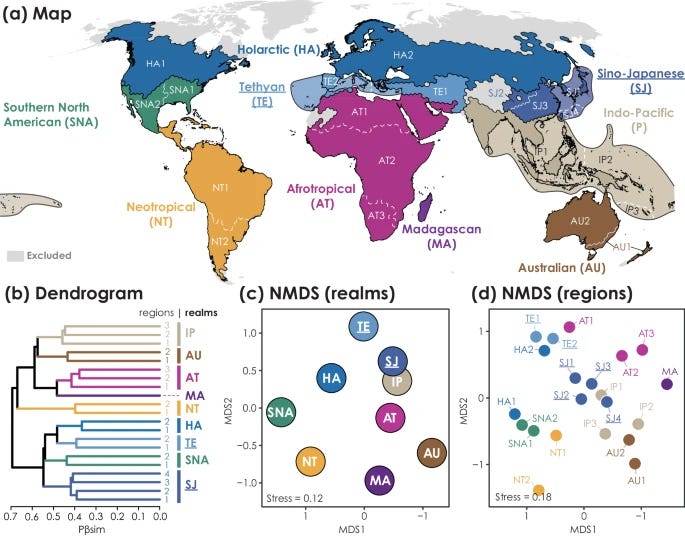
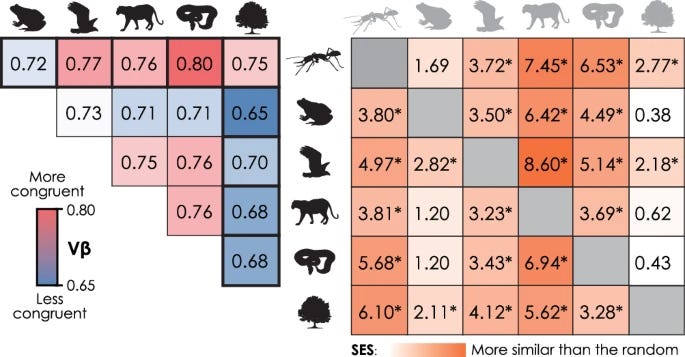
Global biogeographic regions for ants have complex relationships with those for plants and tetrapods (7/5/2024) has links to the data sources, and so theoretically one could reproduce this graph or at least (d). As a bonus, there is a heat map graph below.
Data science Stuff
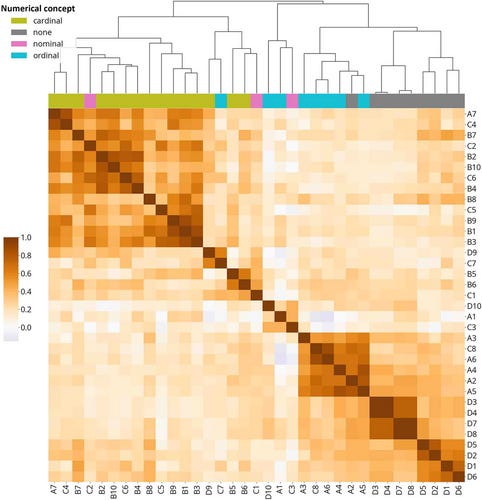
There is a lot going on in Exploring Early Number Abilities With Multimodal Transformers (9/3/2024). Maybe good for an independent study or just an example of applications. Here is one graph to get you interested in the paper.
Please share and like
Sharing and liking posts attracts new readers and boosts algorithm performance. Everything you do is appreciated.
Comments
Please point out if you think something was expressed wrongly or misinterpreted. I'd rather know the truth and understand the world than be correct. I welcome comments and disagreement. We should all be forced to express our opinions and change our minds, but we should also know how to respectfully disagree and move on. Send me article ideas, feedback, or other thoughts at briefedbydata@substack.com.
Bio
I am a tenured mathematics professor at Ithaca College (PhD Math: Stochastic Processes, MS Applied Statistics, MS Math, BS Math, BS Exercise Science), and I consider myself an accidental academic (opinions are my own). I'm a gardener, drummer, rower, runner, inline skater, 46er, and R user. I’ve written the textbooks R for College Mathematics and Statistics and Applied Calculus with R. I welcome any collaborations.