


Does America have a life expectancy crisis?
A response to the Washington Post

The Washington Post article America has a life expectancy crisis. But it’s not a political priority. (12/28/2023) makes almost no attempt to define, describe, or quantify America's alleged life expectancy crisis. There is an occasional nod to the life expectancy for a couple of states and broad comments like this one (note that the link in this quote is to another Washington Post article from November 2019):
Despite the flurry of legislation, the nation’s progress on life expectancy has stalled, with the United States increasingly falling behind other nations well before the pandemic. No senator has crafted a bill specifically intended to improve life expectancy or create goals for health leaders to reach.
So, is there a life expectancy crisis? If so, can legislation address it? And is it the fault of our "failed" health care system, as Bernie Sanders claims?
In comparison, Sanders has repeatedly called for sweeping reforms, insisting in an interview that “a failed health-care system is tied into a corrupt political system dominated by enormously powerful corporate interests.”
Multiple factors complicate life expectancy in the United States, as they do with most problems. Let’s go to the data and shed some light on life expectancy in the U.S.
Figure 1 begins our tour with a comparison of country life expectancies throughout time. The blue line corresponds to the United States. Life expectancy for this group of countries has increased over time, with a COVID-related decline in the last couple of years. We can additionally observe that life expectancy growth in the United States started to slow down around 1980 or 1990. There is a clear difference between the United States and the other countries higher on the list.
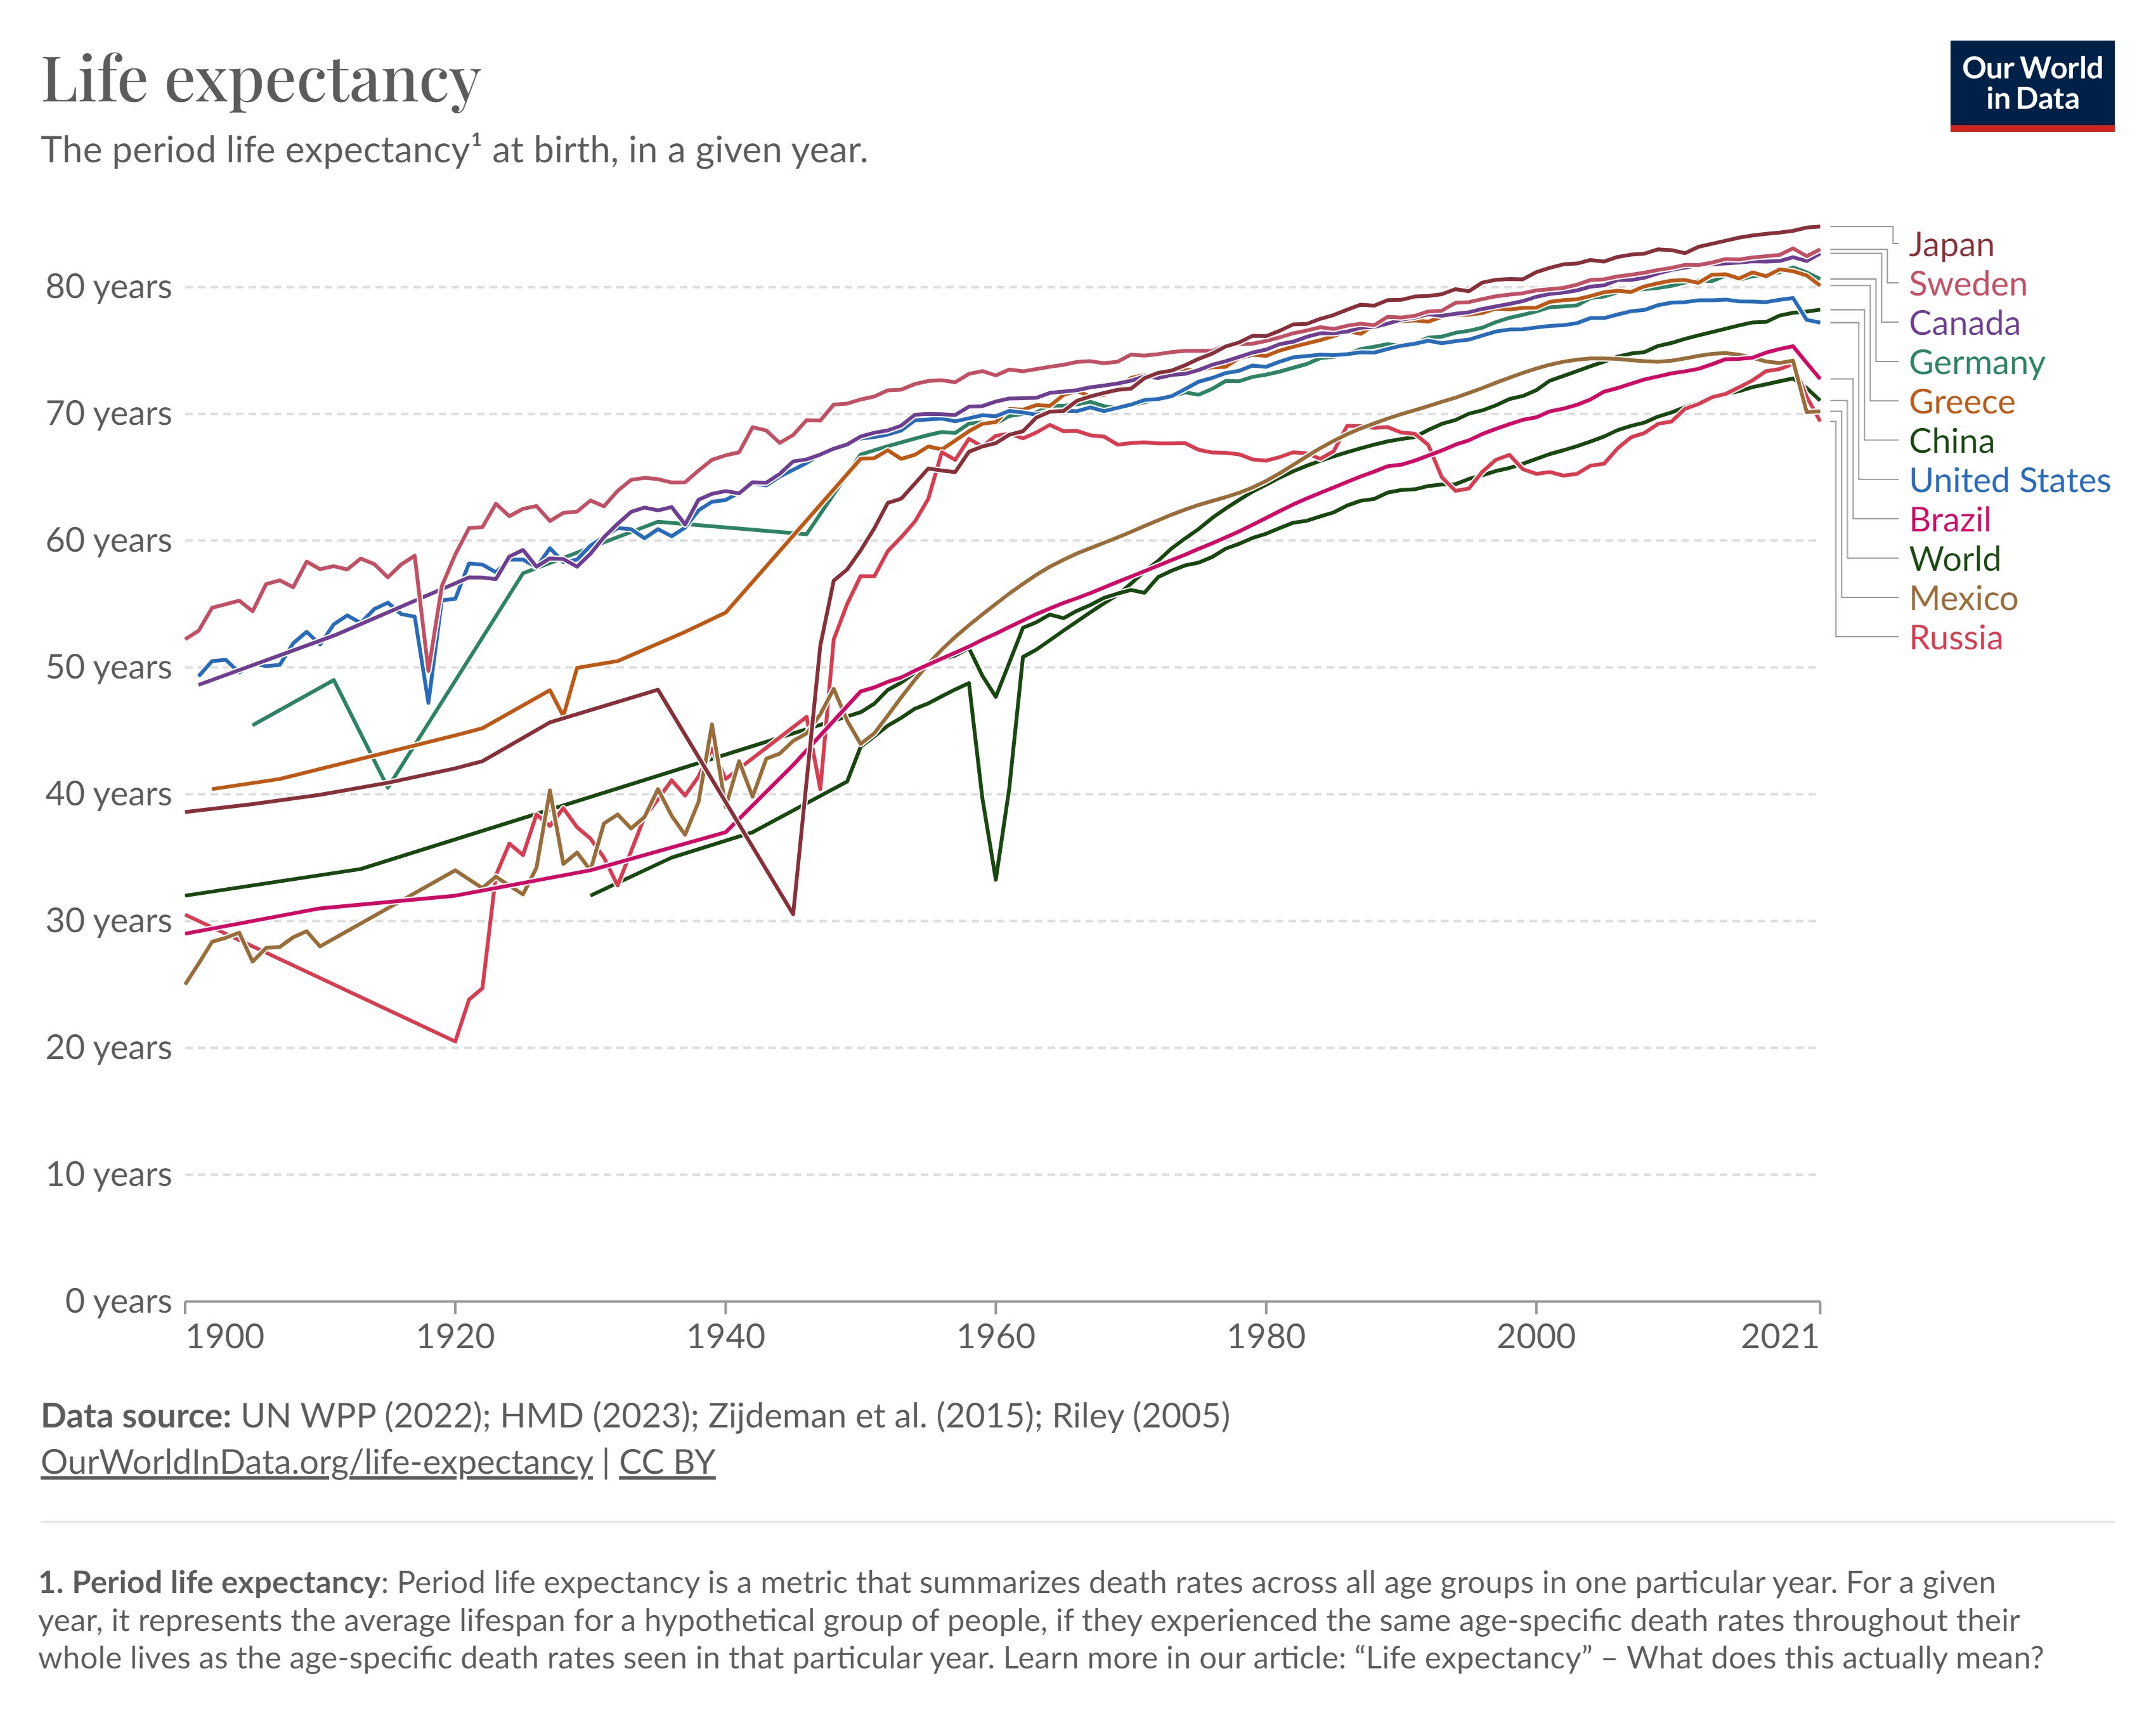
Figure 2 provides the life expectancy in 2021 for the same countries as in Figure 1. The U.S. life expectancy of 77.2 years is good but 7.6 years behind Japan, 5.8 years behind Sweden, 5.5 years behind Canada, and 3.4 years behind Germany. Who then is the appropriate comparison country?

The four counties mentioned that are ahead of us are much more homogenous, and the heterogeneity of the U.S. can create some differences and challenges in a metric like life expectancy.
Life Expectancy by Race, Ethnicity and Sex
Figure 3 is data from the CDC National Center for Health Statistics. Note that the CDC data is slightly different from the Our World in Data results, but close enough. Consistently, men have a lower life expectancy than women for all groups. In total, men have a life expectancy 5.8 years lower than women. Apparently, this isn’t a crisis or worth worrying about.
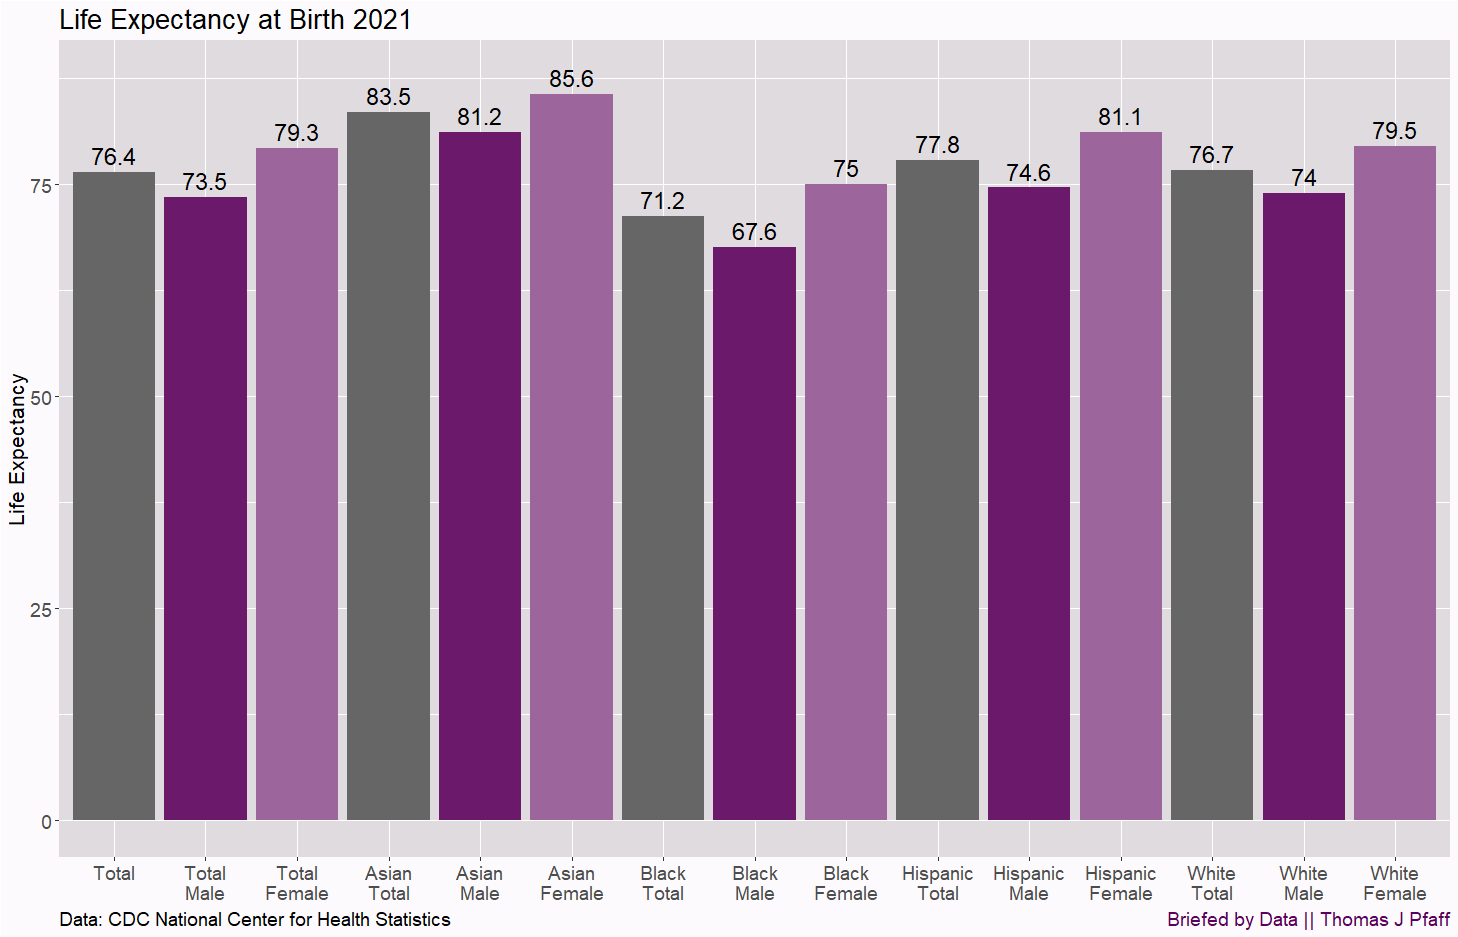
Notice that the Asian total of 83.5 is not far from Japan's 84.8. When compared to Japan, it appears that Asians are not significantly worse off in the United States. This alone calls into question the extent to which the United States' health-care system has failed. This also implies that not all of America has a life expectancy problem.
Now, if you haven't noticed, Figure 3 contains an interesting surprise. Hispanics have the second highest life expectancy, at 77.8 years, more than a year higher than the White population. This is despite the fact that Hispanics have a far higher uninsured rate (18%) than the White or Black populations, which are 6.6% and 10%, respectively. Asians are at 6%. (2022 rates from KFF 1/11/2024) Also noteworthy is the disparity between Black males and females, which is largely attributable to Black males' lower life expectancy.
At this stage, it is reasonable to assume that genetics and culture play a role in life expectancy. Figure 4 shows the same information as Figure 3, but with 2019 data, which predates COVID.

The life expectancy in 2019 was higher for all groups. The U.S. certainly had a larger drop in life expectancy than other countries, as seen in Figure 1.
Expected years to live at a given age
When someone talks about life expectancy, they really mean life expectancy or expected years to live at birth. The CDC provides us with life expectancy, or really expected years to live, at each age. Figure 5 shows this data for males.

To understand Figure 5, consider a Hispanic or White male age 50. According to Figure 5, they are predicted to live for another 30 years, or until the age of 80. In general, each year a person lives, the number of years left to live decreases by less than one year. Most people associate life expectancy with y-values at age zero.
There are two things to observe in this graph. Hispanic and White males exhibit nearly identical profiles, although their two curves separate a tiny amount near age 75 in favor of Hispanic males. Despite all of the "privileges" that come with being a White male in the United States, they live no longer than Hispanic males and are well behind Asian males.
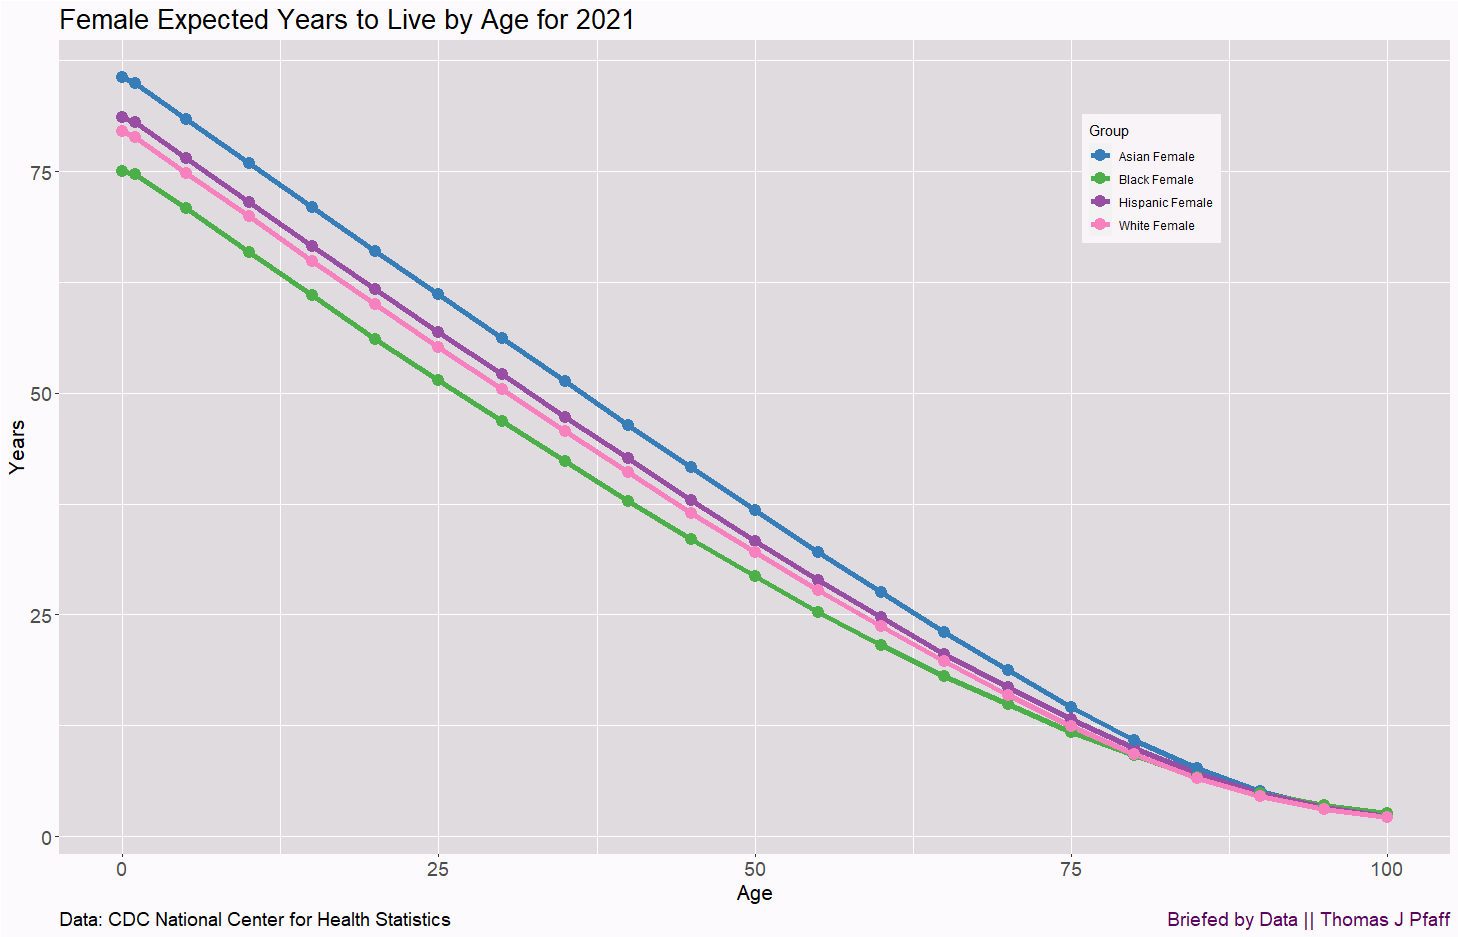
The second thing to note is that the curve for Black males is flat from year zero to year one. There appears to be a significant death rate among Black males under the age of one. If they live to the age of one, their year of death increases by nearly a year. Figure 6 shows similar tendencies for females, with the exception that White females are slightly lower than Hispanic females.
So far, Asians in the U.S. don’t seem to have a life expectancy problem. The overall White population is behind Canada and Sweden by 6 and 6.3 years, respectively, but 3.9 years behind Germany. The Hispanics population in the U.S. outlives the White population and is ahead of Mexico by 7.6 years. On the other hand, the Black population is doing the worst by far. The U.S. could do better, but this is hardly a crisis. But there is more to the story.
Education and life expectancy
The paper Life expectancy in adulthood is falling for those without a BA degree, but as educational gaps have widened, racial gaps have narrowed (3/8/2021) has two great charts. The first one, Figure 7, is like Figures 5 and 6 in that it gives the expected years to live for a person aged 25. By 2019, there was a three-year gap between those with a BA or more and those without. Note that we should not assume that getting a degree causes an increase in life expectancy. As I’ve mentioned before, there is a bias in the selection process for who goes to and completes college.
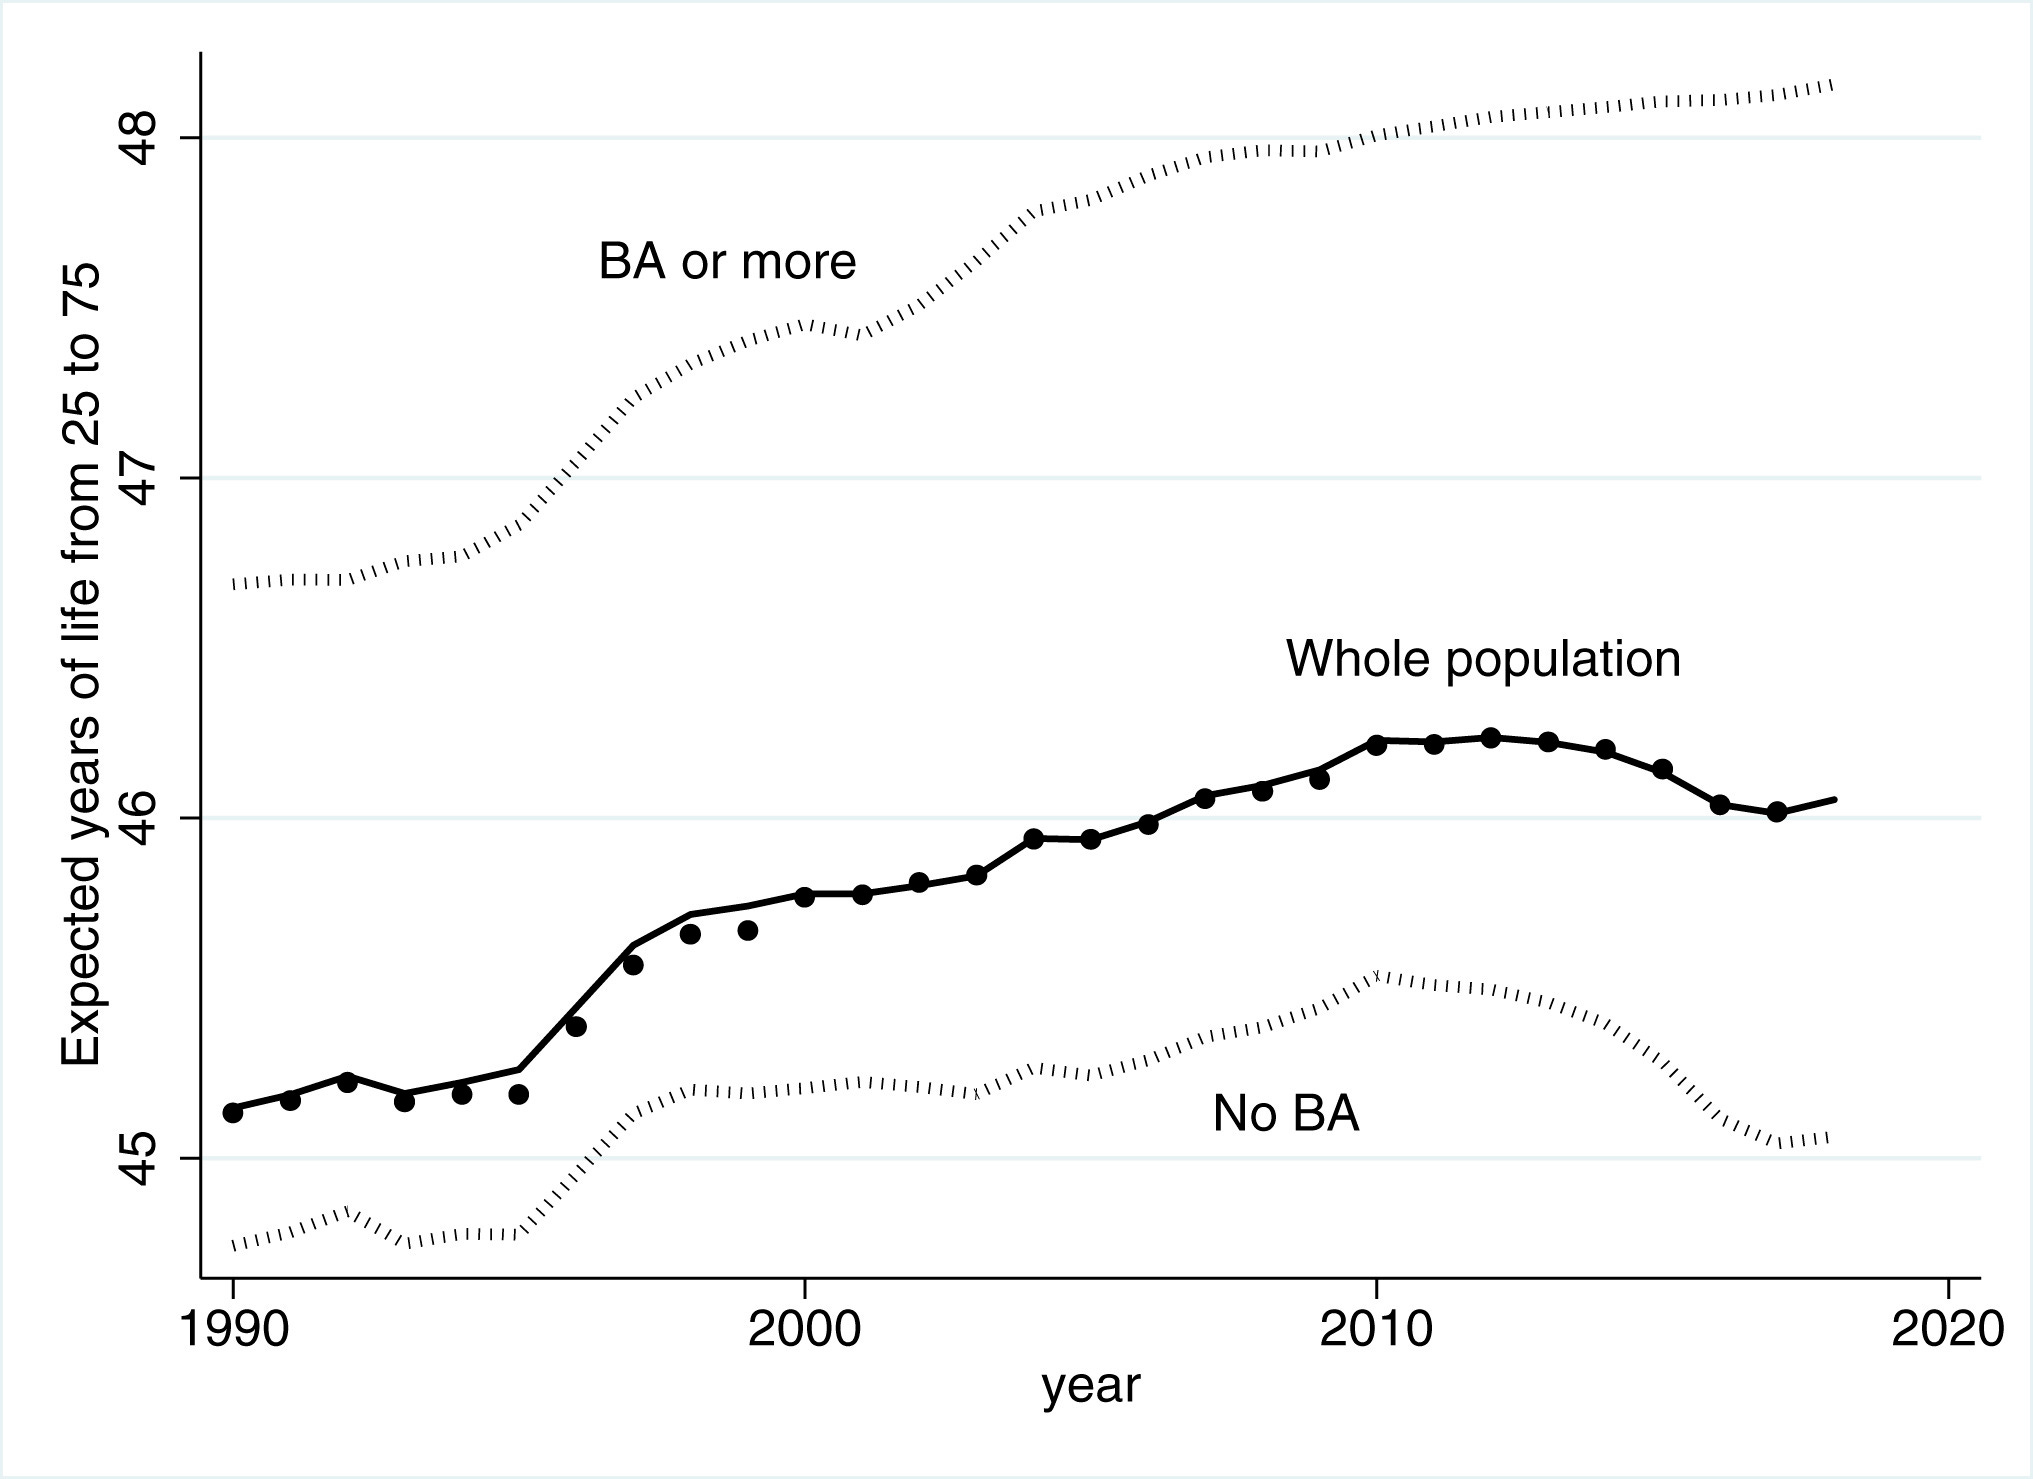
Still, when we think about the overall U.S. life expectancy, Figure 7 shows that it is being lowered overall by the No BA group. The paper digs deeper (Figure 8) and shows the difference by education, race, and sex.
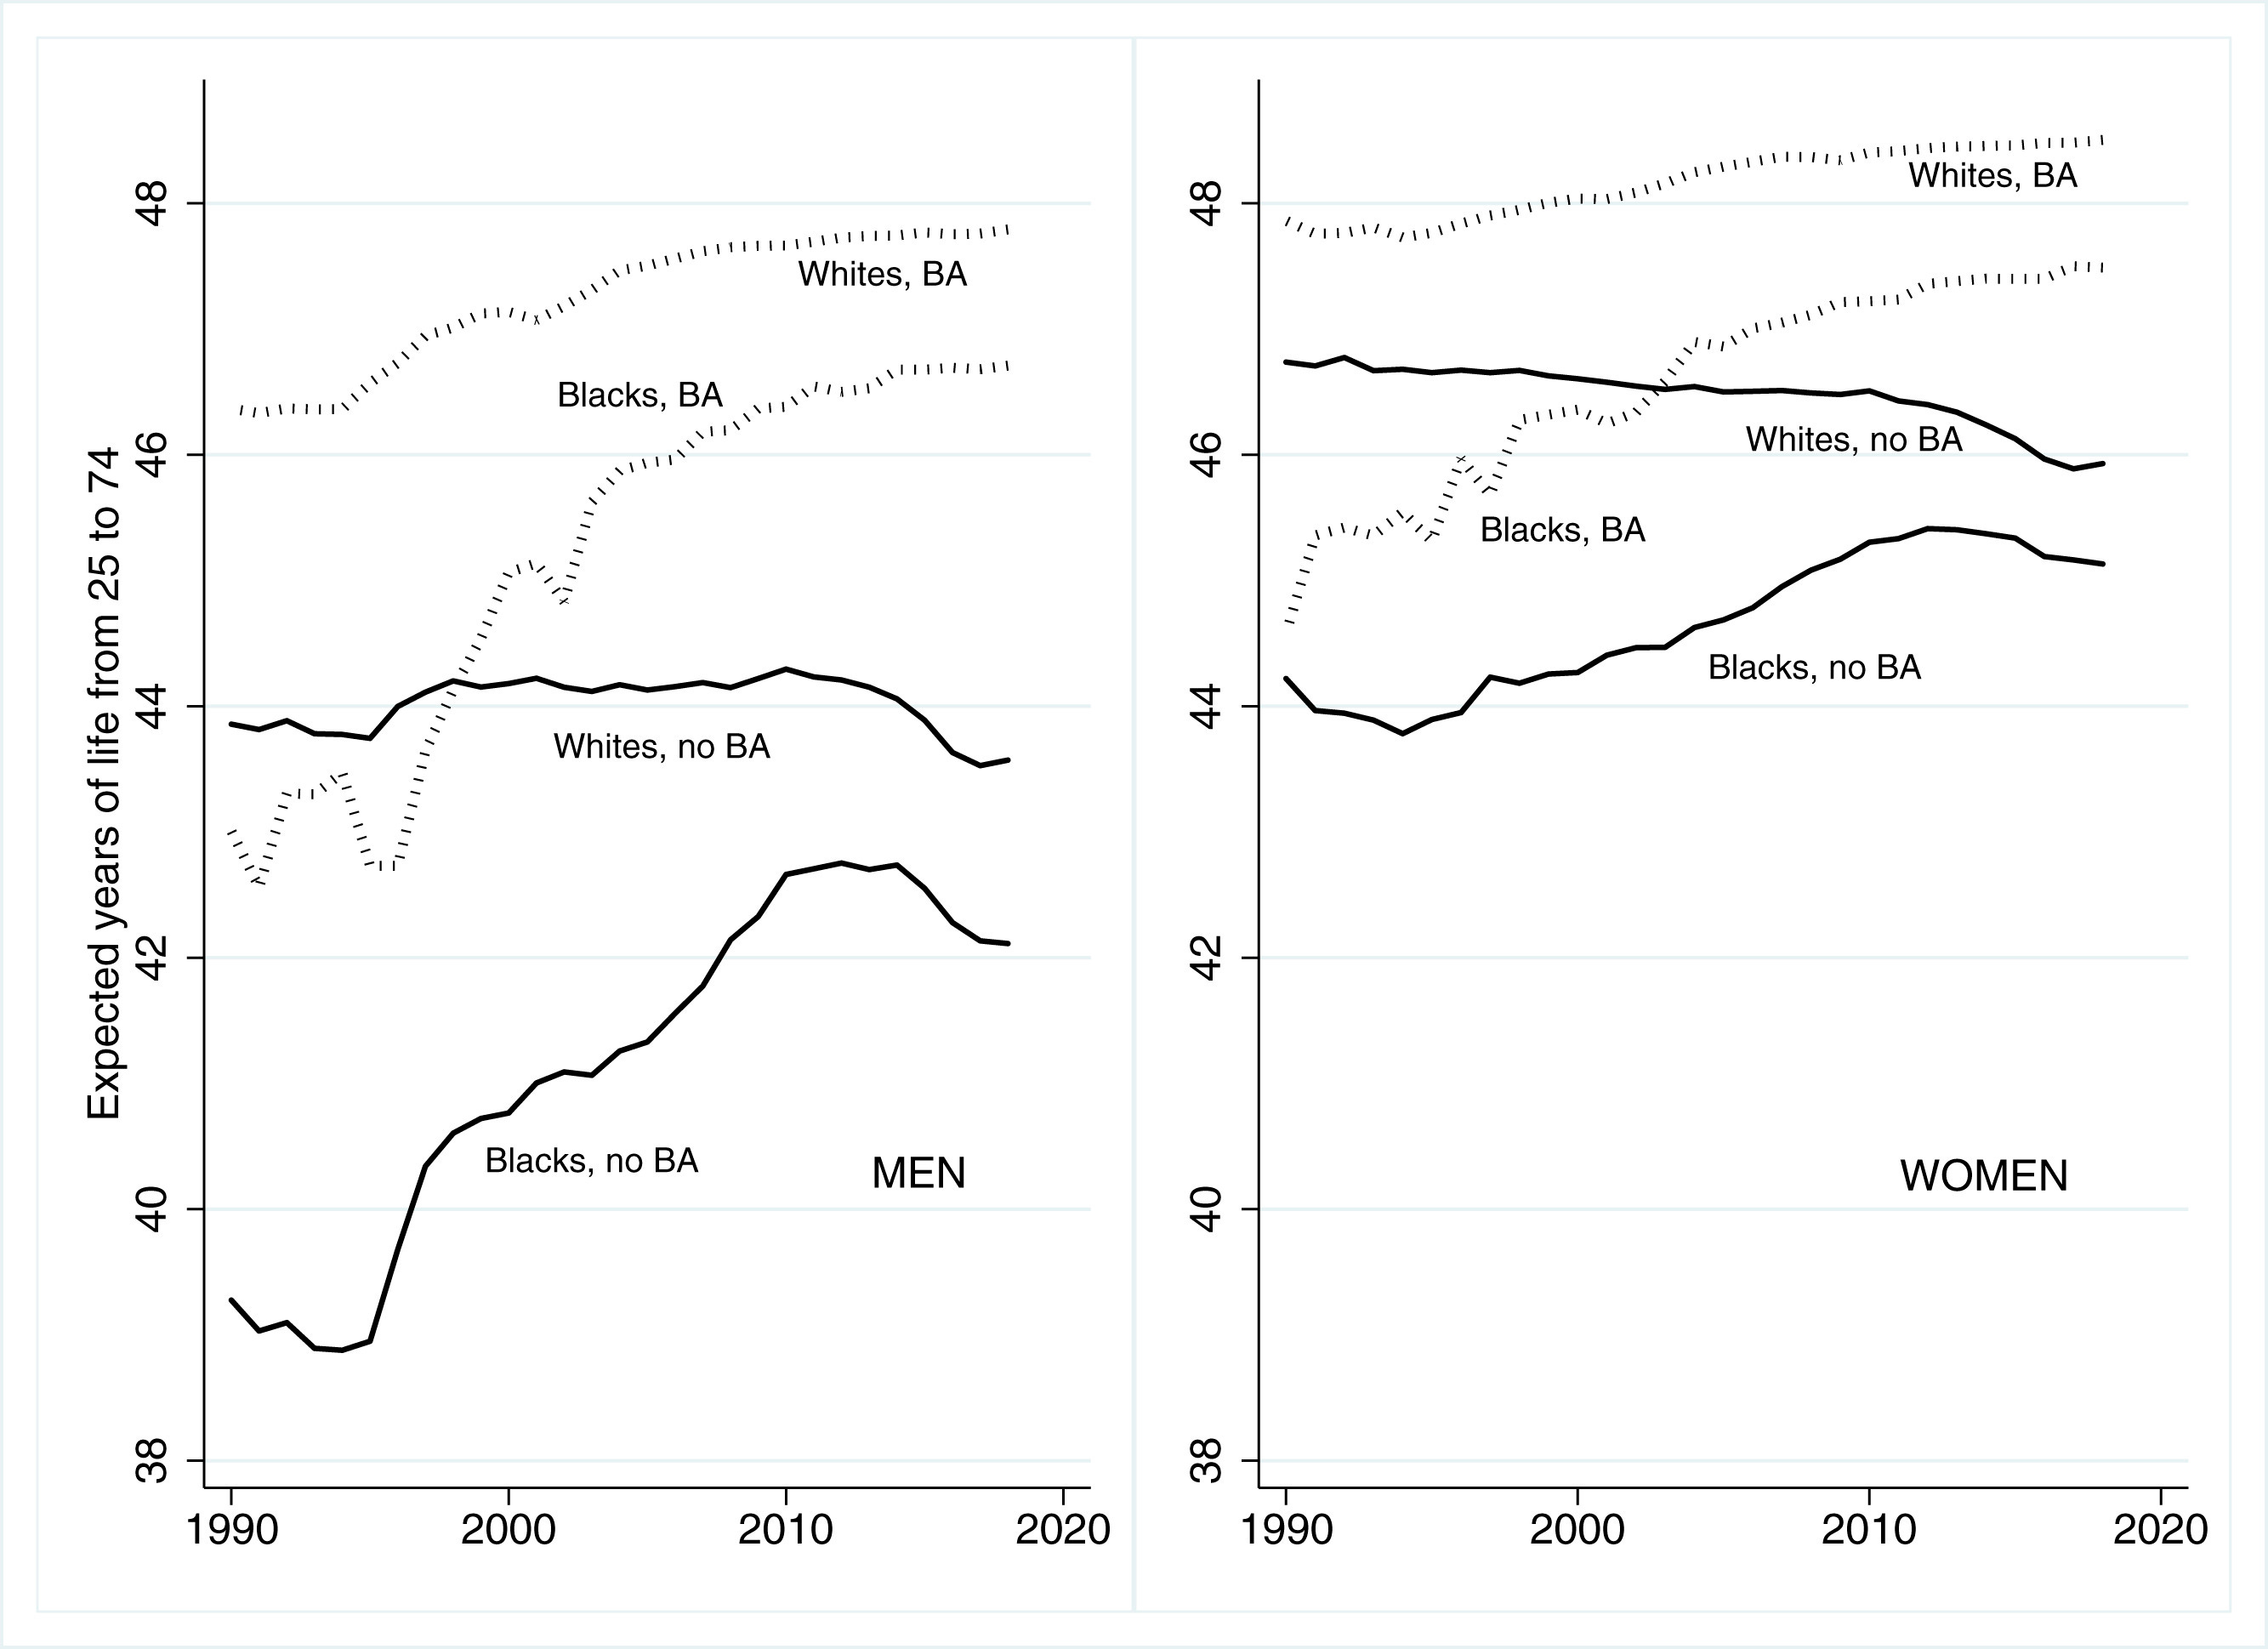
In 2019, the gap between Black males with and without a degree is about 4.5 years, while the gap between White and Black males with a degree is only about 1 year and closer to 2 years for the groups without a BA. The pattern is similar for women in that the gap between Black females with and without a degree is larger than the gap between Black and White women with a degree. Worse, there is a decline in years to live at age 25 for all no BA groups starting around 2010, and while the downturn to 2019 is a year or less, it was going in the opposite direction of the BA group, opening up a larger gap.
Conclusions
Does America have a life expectancy crisis? No. We could certainly do better as a country, but it isn’t the case that all of the U.S. has a problem. Black men have a problem, and in particular, Black men who didn’t complete a college degree are not doing well. I might say that this is a crisis.
Is it the fault of our health care system? As someone who favors some form of universal coverage, I don’t think we can blame all or even most of life expectancy issues on our health care system. Hispanics live longer than Blacks with higher uninsured rates. Asians are generally doing well with our system. Sure, it could be better, but I don’t see it as explaining all of, or even most of, the life expectancy issues.
The Washington Post article surveys all 100 senators to see if they think life expectancy is a problem or not, and this is a key basis for their article. For probably all of them, they should respond, but I’m not sure. Instead, we get this response from Sander
“The administration, the Congress should have upon their wall, a chart which says … ‘What’s our life expectancy now [and] how do we get up to the rest of the world?’” Sanders said. He pointed to Norway’s life expectancy of more than 83 years. “That should be our goal.”
Why Norway? Why not chase Japan at almost 85 years of life expectancy? What if a good bit of life expectancy is genetic and cultural? Can or should the government address life expectancy at all as a goal? Maybe we can start with better reporting on the issue.
You now know more about life expectancy in the U.S. than your state senator.
Please share and like
Please help me find readers by forwarding this article to your friends (and even those who aren't your friends), sharing this post on social media, and clicking like. If you're on Twitter, you can find me at BriefedByData. If you have any article ideas, feedback, or other views, please email me at briefedbydata@substack.com.
Thank you
In a crowded media market, it's hard to get people to read your work. I have a long way to go, and I want to say thank you to everyone who has helped me find and attract subscribers.
Disagreeing and using comments
I'd rather know the truth and understand the world than always be right. I'm not writing to upset or antagonize anyone on purpose, though I guess that could happen. I welcome dissent and disagreement in the comments. We all should be forced to articulate our viewpoints and change our minds when we need to, but we should also know that we can respectfully disagree and move on. So, if you think something said is wrong or misrepresented, then please share your viewpoint in the comments.