Does more renewable electricity reduce prices?
A look at electricity sources and cost by state
I got curious (my curiosity may be more of a problem for me than anything) if there is any evidence that generating electricity through solar or wind reduces costs for consumers. The EIA has this type of data in their Electricity Data Browser, which allows us to compare state-level electricity production and consumer prices.
Before we get to the graphs, here are a few caveats and notes about the data. The data is for May 2024, which is the most recent data available. It is one month, but I thought the most recent month would be more interesting, even though it is only a snapshot and will vary from month to month. The results could be different if a different month was used. I also added the political identification of each state, red/blue, using the World Population Review metric for 2024. Let’s go to the data and see what we can learn.
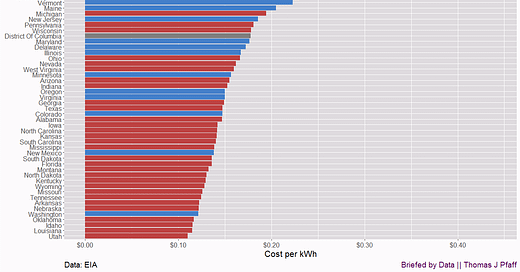
Figure one is just the electricity cost by red/blue status. Nine of the top ten costs are blue states, although Hawaii should be discarded and probably Alaska as having unique energy challenges. If we do that, the top nine states are all blue.

Since we expect blue states to generate more renewable electricity, it might seem that renewables increases cost. Of course, we look at the data because our expectations might be wrong.
Figure 2 compares the percentage of electricity generated by wind and (utility scale) solar to electricity costs. It is important that we use percentage instead of quantity to control for smaller and larger states.
Surprisingly, it is red states in the top three spots for the percentage of wind and solar electricity generation. It is natural to want to add a regression line, and I did, but it isn’t significant (p-value = 0.389). In other words, there is no relationship between percentage of wind and solar electricity generation and cost.
What I see here is that red states have lower electricity costs regardless of whether or not they use wind and solar as part of their electricity generation. This suggests that there are other factor at play (data rule: Always consider other factors as single-factor explanations are rare.), such as regulations.
Figure 3 dispels the notion that red states aren't “green.”

It is interesting that, as a percentage of electricity consumed, the top 5 wind states are red states. My take here is that geography is what is driving this. They are states where wind is abundant and it makes sense to install turbines. Figure 4 is the same chart but with solar instead of wind.

Two of the top 3 states in Figure 4 are red states, and again, based on geography, the top few states make sense. On the other hand, the New England states in the 4-6 spots are a bit surprising.
Figure 5 examines the correlation between the cost of electricity and the proportion of natural gas-generated electricity. Again, there is no relationship.

For the month of May 2024, there is no evidence that how electricity is generated has any relationship to the consumer cost of electricity. Given the data I have here, the political identification of the state is the largest predictor of cost. Why? I’m going to guess it is tied to regulations and taxes.
Please share and like
Sharing and liking posts attracts new readers and boosts algorithm performance. Everything you do is appreciated.
Comments
Please point out if you think something was expressed wrongly or misinterpreted. I'd rather know the truth and understand the world than be correct. I welcome comments and disagreement. We should all be forced to express our opinions and change our minds, but we should also know how to respectfully disagree and move on. Send me article ideas, feedback, or other thoughts at briefedbydata@substack.com.
Bio
I am a tenured mathematics professor at Ithaca College (PhD Math: Stochastic Processes, MS Applied Statistics, MS Math, BS Math, BS Exercise Science), and I consider myself an accidental academic (opinions are my own). I'm a gardener, drummer, rower, runner, inline skater, 46er, and R user. I’ve written the textbooks R for College Mathematics and Statistics and Applied Calculus with R. I welcome any collaboration.


It would be interesting to disentangle the reasons why some (red) states have abundant alternative energy and low cost while some (blue) states have much higher cost for less alternative energy. Geography plays a role as you said. Is NIMBY making alternative energy more expensive in some (blue) states?