

Fact checking Kimberlé Crenshaw
A review of fatal police shootings

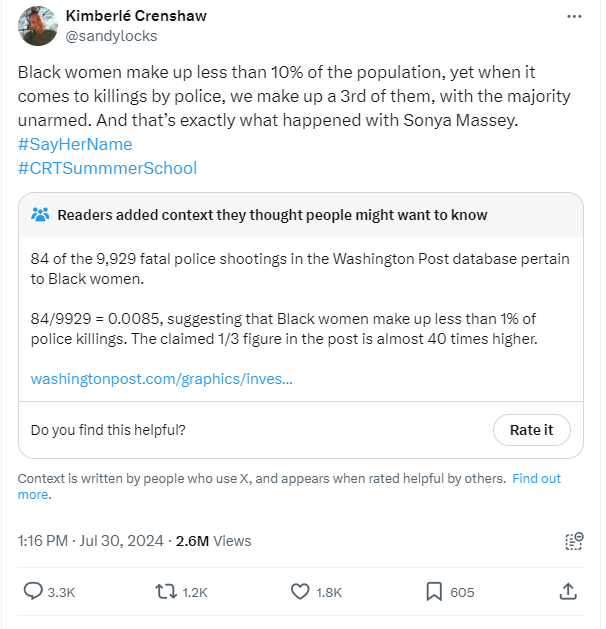
Kimberlé Crenshaw had a tweet about a week ago that got a lot of attention (Figure 1). A community note was added, and Kevin Drum had this to say.
Kimberlé Crenshaw is way too famous and influential (188,000 followers on Twitter) to post recklessly incorrect stuff like this. Where does it come from?
Crenshaw has made three data statements:
Black women make up less than 10% of the population.
Black women make up a third of killings by police.
The majority of Black women killed by police were unarmed.
Are each of the three of these claims true? Let’s go to the data to find out. For what I'll refer to as fatal police shootings (a more neutral term), I'll utilize data from Mapping Police Violence. Overall, I believe their data is good, and if anything, it is biased against the cops. In other words, I'll use the data source that benefits Crenshaw. The Mapping Police Violence data spans the years 2013–2024 (until the end of July 2024), with 13,398 observations. Note that 32 of them are not labeled as male or female, therefore, I've excluded them from the charts below.
Statement 1
Yes, Black women account for fewer than 10% of the population. In my U.S. Demographic by Age post, I noted that the Black population was 13%, with women accounting for 7-8%. Now, if you want to talk about fatal police shootings, you might not use the general population because older individuals have fewer police troubles. The Black population is approximately 14% at younger ages; therefore, this does not alter significantly. Statement 1 is true but incorrect by a significant margin, as 8% is 20% less than 10%.
Statement 2
Her second assertion, “Black women account for one-third of police killings,” is susceptible to interpretation. Let us begin by reviewing the data on fatal police shootings, and along the way, try to determine if this statement is true.
Figure 2 shows the data on fatal police shootings (FPS) by race and gender. It's not unexpected that women account for a much smaller proportion of the FPS (as we all know, the police are anti-male /s). Women make up barely 5% of the Black population fatally shot by police, compared to 7% in the White and Hispanic groups. Overall, Black women make up 21% of all women fatally shot by police. Statement 2 does not appear to be accurate. Now, before we return to assertion 2, we'll take a brief detour to discuss Figure 2.

We frequently hear about how Black people are fatally shot by police at a disproportionate rate compared to white people. Overall, the white population is 60%, whereas the black population is 13%, or 4.6 white people for every one black person. If we confine ourselves to younger people, the ratio is more like 53% to 13%, or roughly 4.1 to 1. In any case, the Black bar is far greater than it would be if FPS were proportionate to the population, as it is more than half the White count. Before we return to Statement 2, I'd like to make two points.
First, considering FPS as compared to the general population falls under the data rule: Normalize properly; ask, "Per what?” But is this the proper normalization? For example, we may compare FPS to homicide rates. I've previously used Figure 3 (Media's focus on White supremacy harms Black communities, 9/23/2023), but it's worth reposting.

There are almost as many Black-on-Black homicides as White-on-White homicides. Given this, it appears that there is more violence in the Black community, and hence more police intervention. One might anticipate the bars in Figure 2 for white and Black to be more equal. The point here is that comparing to the overall population makes little sense, and furthermore, one also needs to take in other factors such as age (the median age of the Black population is 9 years younger than the White population) and location.
It is also worth noting that the ratio of Hispanics to Whites is nearly identical to the proportions in Figure 2. Overall, the population ratio is 60% to 19%, or 3:1. The graphic shows a ratio of 2.45 to 1 for whites to Hispanics, while for the younger population, the ratio is closer to 2.3. In other words, Figure 2 is about proportional to the population for the White and Hispanic populations.
Back to assertion 2: Black women account for one-third of police killings. Black women account for barely 5% of all fatal police shootings. They account for only 21% of women fatally shot by police. I also checked each year individually, as Crenshaw may be cherry-picking a year. In 2022, Black women accounted for 32% of women fatally shot by police, the highest proportion. We obtain the next-highest percentage in 2024, which is not yet full, at 28%, and 26% in 2019. The most liberal reading of statement 2 is that it only applies to 2022. Nonetheless, the assertion is inaccurate at best and largely dishonest.
Statement 3
How about her third assertion, "The majority of Black women killed by police were unarmed?" Figure 4 shows a grouping by race and year of unarmed women who were fatally shot by the police. I'm only including Black, Hispanic, and White because the other races are very small in comparison. In most cases, Black women don’t even exceed White women, so this can’t be what Crenshaw means.

One more attempt in Figure 5. Statement 3 could be interpreted as referring to Black women only; in other words, the majority of FPS of Black women are ones where the Black woman is unarmed. In Figure 5, for this to be true, the blue bar must be greater than the sum of the red and purple bars. 2024 should not be considered because the year is incomplete. In 2014, 2019, 2020, and 2023, Statement 3 is correct.

Combining all years of fatally shot Black women, we get 69 allegedly armed, 14 vehicles, and 69 armed. If you exclude the car, the result is a tie. Unless you cherry-pick specific years, you cannot conclude that the majority of Black women fatally shot by police were unarmed, though it is close. The statement is largely not true. The problem here is that the tweet makes it seem like police are killing unarmed Black women at a much higher rate than armed Black women, which is certainly not true. In this case, the statement is certainly inflammatory, even though it is close to true overall and true for selected years. At a minimum, it should be clarified.
Given Crenshaw’s influence, the tweet should be removed, followed by a tweet that apologizes for, let’s say, the lack of clarity, followed by clarifications. The fact that the tweet has been up for at least a week suggests she has no interest in clarity, accuracy, or honesty. One should expect bad policy when you start with incorrect information.
Bonus maps
Since I had the data in R, I thought it would be interesting to see how FPS by race is distributed around the country. Figure 6 is such a map. For clarity, I excluded AK and HI; otherwise, the lower 48 map gets too small.

The narrative that cops are just all around racist doesn’t hold across the county. There are clusters, which are partly based on the demographics and population sizes of each location. For example, it looks like in North Dakota and Wyoming, only White people are fatally shot (/s). Substack doesn’t allow me to post an interactive graph that I would make with R. It would be nice if you could zoom in and select each race or ethnicity. The best I can do is leave you with an animation.
Please share and like
Sharing and liking posts attracts new readers and boosts algorithm performance. Everything you do is appreciated.
Comments
Please point out if you think something was expressed wrongly or misinterpreted. I'd rather know the truth and understand the world than be correct. I welcome comments and disagreement. We should all be forced to express our opinions and change our minds, but we should also know how to respectfully disagree and move on. Send me article ideas, feedback, or other thoughts at briefedbydata@substack.com.
Bio
I am a tenured mathematics professor at Ithaca College (PhD Math: Stochastic Processes, MS Applied Statistics, MS Math, BS Math, BS Exercise Science), and I consider myself an accidental academic (opinions are my own). I'm a gardener, drummer, rower, runner, inline skater, 46er, and R user. I welcome any collaboration.
Admittedly I did not understand everything about how to run these analyses, but I did want to point out that...there is a baseline for me which is that "police killing people sucks." It's a crappy aspect of policing and of people's interactions with police. Unconscious bias of all sorts is hard to test, document, and examine but it, plus other things, are implicated. But/and, it is vital for anyone with a large/huge platform to take care with how they describe statistics and assert 'facts.' Thanks for all this food for thought.