From a Normal Distribution to a Pareto
A model to illustrate income inequality
In last week's post, “The Normal Density and Percentiles,” I showed how the distance between percentiles in a normal distribution grows as we move toward the tails. Now, normal distributions are important, but there are other distributions that are just as important but aren't talked about in a standard statistics course. In this post, I'll show how a normal distribution can lead to a Pareto distribution.
Most scenarios that come from averages fit the normal distribution. Height is a good example because we could say that a person's height is an average influenced partly by the heights of their parents, grandparents, etc., and partly by their environment. It is also a fair assumption for skills and ability. Now, let's say that our community has a normal distribution of skills and that the average hourly wage is $20. We'll pay you an extra $10 per hour for every standard deviation from the mean, with a $10 per hour minimum. In this case, the distribution shown in Figure 1 was made by randomly picking 100,000 people from a normal distribution (which is why the median isn't exactly $20).

Figure 1 is, as expected, skewed to the right. With some people making at least $60 per hour. 33% of all income goes to people who make more than the 80th percentile. In the real world, pay goes up faster than a straight line as skills go up. Sports is the best example of a situation where the best player makes a lot more than the average player. To illustrate this, we'll change the way pay is scaled.
In our second case, pay goes down by $10 per standard deviation below the mean, but it goes up by (exp(x)-1)*10 per standard deviation above the mean, where x is the number of standard deviations from the mean. In other words, it will grow as an exponential function times $10, where we subtract 1 so that it starts at 0 (remember that exp(0)=1). Again, nobody earns less than $10 an hour. Figure 2 shows the distribution of the results. We stopped the x-axis at $100, but the highest hourly pay is $777.63. Look at how the top 20% of earners now get 44% of the total income.

In this context, a Pareto distribution would have the top 20% earning 80% of the income. The Pareto distribution is actually a family of distributions, and the “80-20 rule” only applies to those with a shape parameter of about 1.16. We're not there yet, so let's change our pay scale so that people who make more than the mean get an extra (exp(x-1)*60). In this case, the only difference is that we increased by $60 instead of $10. Why $60? The point is to keep the example as easy as possible, and $60 works well enough. What we get is shown in Figure 3.
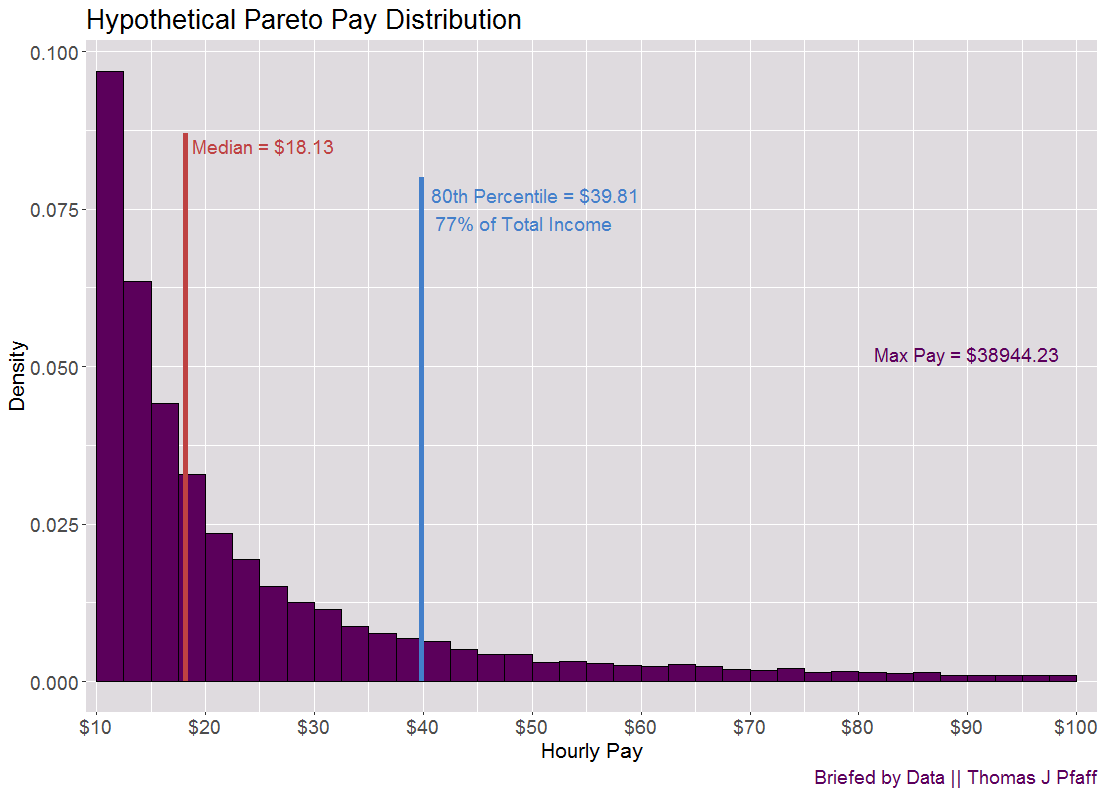
The top 20% of earners now make about 70% of the money, with a maximum pay of $4565.79. The way we set up the pay scale isn't very smooth because it drops off at $20. Still, this gets the point across. In a situation like this, what would a Perato distribution look like? Figure 4 shows a Perato distribution with a minimum value or shape value of $10 and a scale factor of 1.16. The 80th percentile is lower, but the middle is about the same. On the other hand, the maximum is much higher at $38944.23, so the tail is much longer.
Pareto distribution, or really the '“80-20 rule,” fits a number of natural phenomena, such as the distribution of the size of wildfires or the strength of earthquakes, as well as human activities. Here is a great list and a few examples from that list: 80% of the wealth is owned by 20% of the population, 80% of crimes are committed by 20% of criminals, 80% of your knowledge is used 20% of the time, 80% of a company's absenteeism is caused by 20% of staff, and an inverse example is that 20% of your wardrobe is worn 80% of the time.
Please Share
I’d like to get to the top 20% of subscribers on Substack, and I can’t get there without your help. Please share this post with your friends (or those who aren't friends of yours) and on social media to help get the word out about Briefed by Data. You may follow me on Twitter at BriefedByData. Send me an email at briefedbydata@substack.com if you have any suggestions for articles, comments, or thoughts. Thanks. Cheers, Tom.


