There is a lot of talk of the September 2023 anomaly being a record, and it isn’t hard to find people going a bit crazy about it as if it were something unexpected. Let’s go to the data and explain that it isn’t all that surprising. I do this not because I think climate change isn’t serious, but because I really dislike the media misleading people. I don’t think it helps in understanding climate change. First, Figure 1 gives us the September anomalies.
If we look at Figure 1, we see that 2023 is a big jump with an anomaly of 2.592 °C, which is 47% higher than the previous September record of 1.764 °C in 2020. Recall Data Rule 1: Avoid making assumptions based on a single factor, and Data Rule 2: Large disparities warrant skepticism. First, note that the previous EL Niño year was in 2015. The expectation is that 2023 will end up being an EL Niño year, but it isn’t official. Generally, records are in EL Niño years, but if it has been long enough since the last one, a non-EL Niño year could be a record, as it is for September (see Figure 3 below for the overall pattern). The result of this would be a larger jump for the new record.
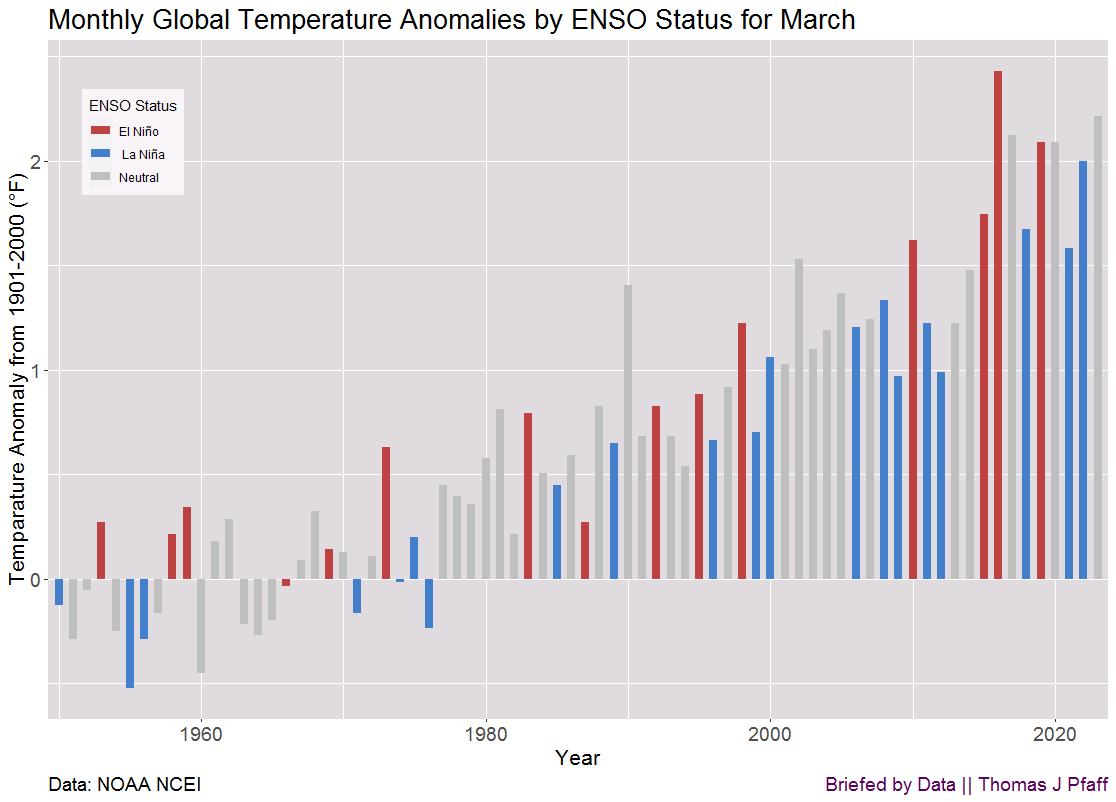
Now, let’s take a look at Figure 2 at the previous anomaly record, which happened in March of 2016, an EL Niño year. March of 2016 (2.430 °C) beat out the previous March (1.746 °C) by 40%, which was also an EL Niño year. The overall trend in anomalies is increasing, and the longer a month goes without a record, the better the chance it breaks the previous record by more. In fact, one might argue that the March 2016 record with a 40% increase from the previous record is more impressive then the current September jump.
Figure 3 shows us all months. The black bar at the end is September 2023 and it really doesn’t appear to be outside of anything unexpected. Notice how Figure 3 isn’t shocking while it is easy to view Figure 1 as surprising. Context is everything.
Some highlights for September 2023 from NOAA.
The September global surface temperature was 1.44°C (2.59°F) above the 20th-century average of 15.0°C (59.0°F), making it the warmest September on record. September 2023 marked the 49th-consecutive September and the 535th-consecutive month with temperatures at least nominally above the 20th-century average. September 2023 was 0.46°C (0.83°F) above the previous record from September 2020, and marks the largest positive monthly global temperature anomaly of any month on record. The September 2023 global temperature anomaly surpassed the previous record-high monthly anomaly from March 2016 by 0.09°C (0.16°F). The past ten Septembers (2014–2023) have been the warmest Septembers on record.
Here is the NASA map of anomalies for September. Be careful in reading the map as the jump in temperature from red to dark maroon is a lot. Overall, almost everywhere was above average with a little white and a tiny blue spot on the map breaking this trend.
I do want to reiterate. I’m not looking to downplay the record September anomaly. The planet is warming and that is bad. But, if the media acts as if this is some big surprise, then I think it is easy for people to think it might not happen again. It will. The trends in Figure 3 are clear. EL Niño years are hotter and while all year are growing quadradically, the anomalies are growing faster in EL Niño years. We should expect more records as this EL Niño and again when the next EL Niño comes around.
Data
ENSO data from Oceanic Niño Index (ONI)
June Global Temperature anomalies from NOAA NCEI
Please share and like
Please help me find readers by forwarding this article to your friends (and even those who aren't your friends), sharing this post on social media, and clicking like. If you're on Twitter, you can find me at BriefedByData. If you have any article ideas, feedback, or other views, please email me at briefedbydata@substack.com.
Thank you
In a crowded media market, it's hard to get people to read your work. I have a long way to go, and I want to say thank you to everyone who has helped me find and attract subscribers.
Disagreeing and using comments
I'd rather know the truth and understand the world than always be right. I'm not writing to upset or antagonize anyone on purpose, though I guess that could happen. I welcome dissent and disagreement in the comments. We all should be forced to articulate our viewpoints and change our minds when we need to, but we should also know that we can respectfully disagree and move on. So, if you think something said is wrong or misrepresented, then please share your viewpoint in the comments.


