


K-12 spending and results
Which state gets the most for their K-12 spending?

The Census Bureau has data on 2023 K-12 public spending, and the most recent Nation’s Report Card has 2024 state math and reading scores. The logical thing to do is to compare spending to results and to add the political leaning of the state using the Cook’s Partisan Voting Index (PVI). Before we dive into the data, let's clarify a few points. I did not try to correct the cost of living. Certainly it is more expensive to live in DC, and hence the cost of school spending will be higher than in, say, Wyoming. In most cases I’m not sure this matters much, as some differences are large. The overall state data does not reflect the differences in state spending on K-12. The most recent PVI had Michigan and Wisconsin as even, and so I coded them based on their previous PVI result.
Let’s go to the data.
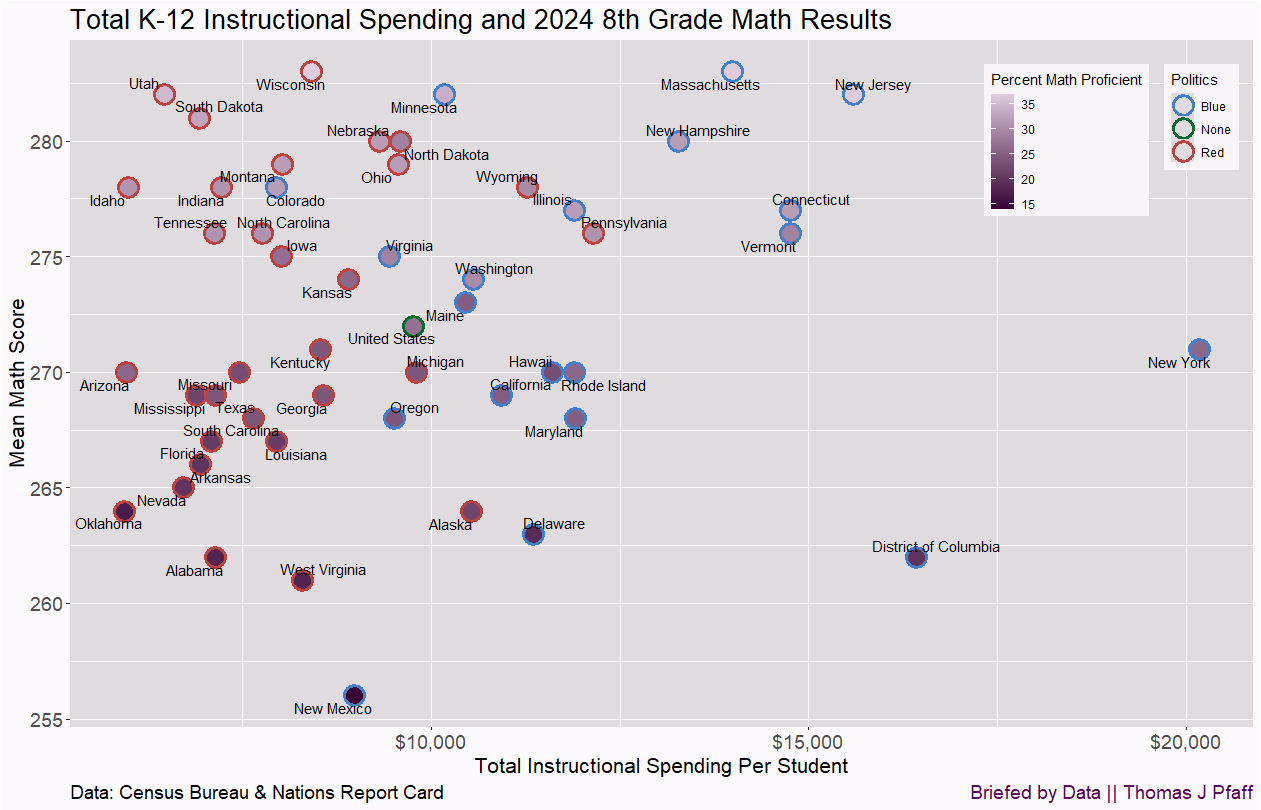
Figure 1 is total K-12 spending and the 8th grade mean math score. The outside color is the political leaning of the state, with the overall U.S. value in green. The shading of the dots reflects the percentage of 8th graders deemed proficient in math. Note that the scale ranges from about 15% to 35%. That’s not a typo; the best states don’t have more than about 35% of 8th graders considered proficient in math. The spending is total spending per student.

I’ll make a few points about Figure 1 even though a lot could be written. DC spends a lot of money on results that are well below average. New York spends a lot and still falls below average. The top nine spending states are all blue. Five of these states achieve above-average results, yet they still cannot get more than 35% of 8th-grade students proficient in math.
Only 4 red states spend above average, yet there are plenty of red states with above-average math scores. Folks like to make fun of Kansas and Kentucky, but they spend less than half what NY spends for equal or better results. Now, some of the difference in spending can be attributed to the cost of living, but not all of it. California spends significantly less on K–12 education for roughly the same math outcomes, despite having a cost of living that is comparable to that of New York.
Overall, it seems that spending isn’t a highly predictive measure of student math results. What about reading?
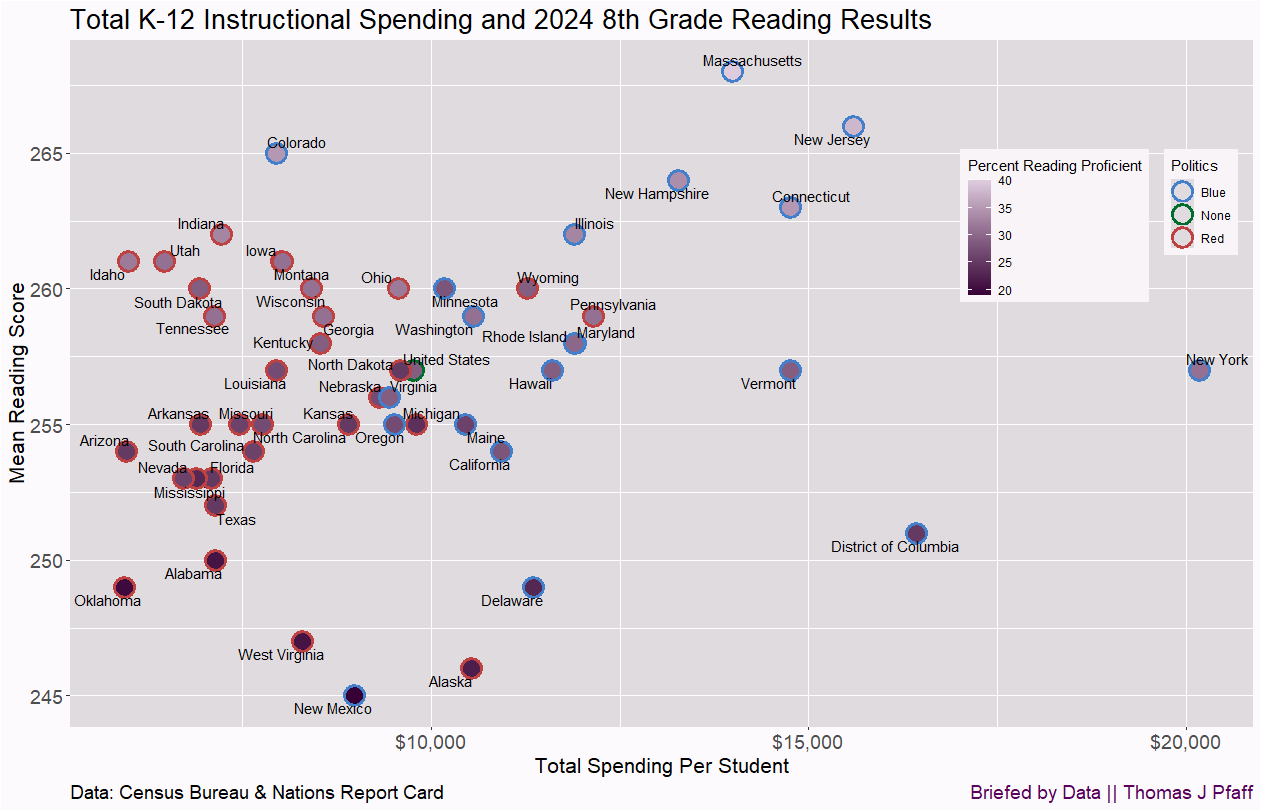
Figure 2 is the same as Figure 1, but for 8th grade reading.

The overall trends are the same for reading as for math. States do a little better with reading, reaching up to 40% proficiency. Generally, but not always, states that are above or below average in math scores are above or below in reading scores. Interestingly, Kansas and Kentucky flipped. Vermont dropped, relative to the U.S. average, from being well above average for math and just above average for reading. Figure 3 captures this information.
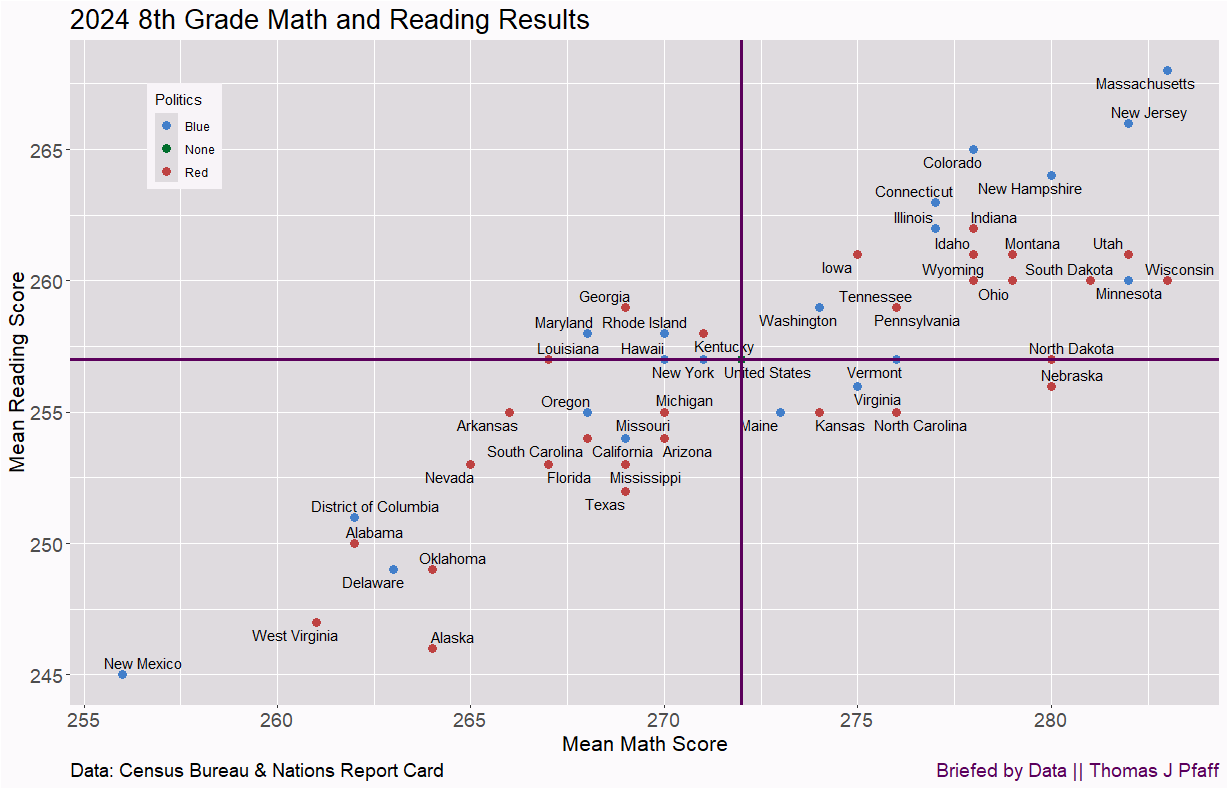
North Dakota performs exceptionally well in math, but its reading performance is only average. On the other hand, Georgia does below average for math but above average for reading. Sometimes you just need the right graph to capture certain information.
Now, you might say, "Well, this is overall spending and not instructional spending.” I’ve got you covered with Figures 4 and 5, which are just like 1 and 2 but use instructional spending on students instead of total school spending. The patterns are generally the same, and you can compare the x-axis between graphs to get how much a state spends on K-12 for non-instructional purposes. For example, NY spends about $10,000 per student for non-instructional purposes.
Let me know what I missed and what other graphs I should make regarding school spending and results in the comments.
Please share and like
Sharing and liking posts attracts new readers and boosts algorithm performance. I appreciate everything you do to support Briefed by Data.
Comments
Please tell me if you believe I expressed something incorrectly or misinterpreted the data. I'd rather know the truth and understand the world than be correct. I welcome comments and disagreement. I encourage you to share article ideas, feedback, or any other thoughts at briefedbydata@substack.com.
Bio
I am a tenured mathematics professor at Ithaca College (PhD in Math: Stochastic Processes, MS in Applied Statistics, MS in Math, BS in Math, BS in Exercise Science), and I consider myself an accidental academic (opinions are my own). I'm a gardener, drummer, rower, runner, inline skater, 46er, and R user. I’ve written the textbooks “R for College Mathematics and Statistics” and “Applied Calculus with R.” I welcome any collaborations.
“That’s not a typo; the best states don’t have more than about 35% of 8th graders considered proficient in math.” That’s an astonishing fact.
Thanks for this analysis. I must confess I immediately looked for Mississippi because of the so-called "Mississippi Miracle," and I was surprised to see it was ranked so low. Then I doubled back to the "Mississippi Can't Possibly Have Good Schools" article and realized that Mississippi is highly ranked not in the raw NAEP scores, but in the Urban Institute's adjusted scores for demographics, which include poverty status. Since Mississippi has a high poverty rate, its adjusted scores are top 4 in the country, but in the unadjusted NAEP scores, as you illustrate, Mississippi is just middle-at-best. Still, it's remarkable that they used to be dead last and are managing to improve student outcomes with so few resources.