


Lake Mead Water Levels
and the scourge of teapot graphs

Lake Mead supplies water to over 20 million people in Arizona, California, and Nevada, as well as farmland. It also generates about 2000 MW of electricity. Unfortunately, Lake Mead's water level has been dropping since roughly the year 2000. Figure 1 depicts Lake Mead's height at the end of the month. When the Hoover Dam was completed in 1934, the lake began to fill. It took until 1941 to complete it. The last time the lake's water level was as low as 1041 feet, which it was at the end of July 2022, was when it was filling up.

Figure 2 shows the end-of-month levels since 2000. Between 2000 and 2011, the water level fell by over 125 feet. The following year, it grew by 50 feet. It fell again from 2012 to 2014, with a brief recovery before plummeting again in 2020, with the current record low of 1041 feet in July 2022. To generate electricity, the water level must be at least 950 feet. Massive winter snowfall has melted and raised water levels, resulting in a 15-foot increase by the end of June. The small increase in June compared to May, however, shows that the rate of increase is decreasing. Although this is not promising, there is some positive news.

Lake Mead is part of a reservoir system, as seen in Figure 3. Lake Powell is located before Lake Mead and has returned to 41% capacity after falling to 22%. The reservoirs above Lake Powell are nearly full. Water was held back at these locations to fill those reservoirs.
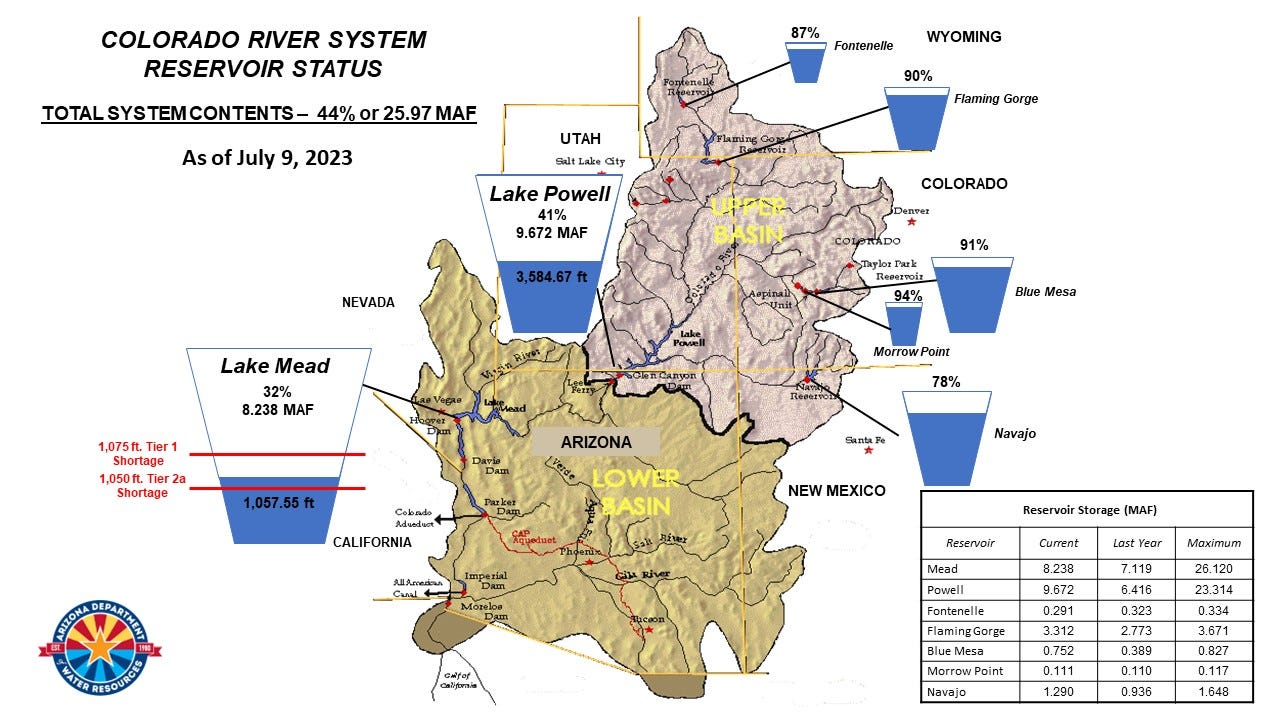
Figure 3 is known as a teacup diagram, and it should be prohibited since it is so deceiving. Two dimensions expressing volume are difficult to compare, but thankfully, a table is added to the graph. Quiz question: Would Lake Mead be filled if all of the teacups above Lake Powell were filled and dumped into it? Try it out and put your spatial abilities to the test.
The maximum capacity of all reservoirs above Lake Powell is 6.597 MAF (Million Acre Feet; 1 million acre foot is approximately 326,000,000,000 gallons). If we filled all of those reservoirs and dumped them into Lake Mead, Lake Mead would be at 14.835 MAF, or 57% of capacity. On a graph, areas should not be used to represent volumes.
In the end, record snowfalls in the west helped, but water levels remain low. It will take a lot of water to fill Lake Mead back up to 2000 levels, and this will have to adjust for regional growth. We'll see what happens, but my guess is Lake Mead will drop below 950 feet before 2030, causing a hydroelectric problem.
Please Share
Please help me find readers by forwarding this article to your friends (and even those who aren't your friends) and by sharing this post on social media. If you're on Twitter, you can find me at BriefedByData. If you have any article ideas, feedback, or other views, please email me at briefedbydata@substack.com.
Disagreeing and using comments
I'd rather know the truth and understand the world than always be right. I'm not writing to upset or antagonize anyone on purpose, though I guess that could happen. I welcome dissent and disagreement in the comments. We all should be forced to articulate our viewpoints and change our minds when we need to, but we should also know that we can respectfully disagree and move on. So, if you think something said is wrong or misrepresented, then please share your viewpoint in the comments.
Data
Figure 3 graph from Colorado River Current Conditions
Lake Mead data from Lake Mead at Hoover Dam, End of Month Elevation (Feet)