


Mental health is not all COVID
A response to Gallup

Making good graphs of data is at least part art, and the choices the creator makes can lead one to a particular view or conclusion of the data. There is nothing particularly wrong with the graph in Figure 1 from the Gallup article Pandemic's Effects Linger in Americans' Health Ratings: After worsening during the pandemic, Americans self-reported mental and physical health remain down (3/13/2025), but if you read the title and then look at the graph, you might miss key facts. My goal for this post is twofold. First is to better analyze this data and make the case that COVID isn’t the only or possibly the main factor in mental health declines. Second, it is to demonstrate how small changes in a data visualization can change what one takes away from the visualization.

To be fair, this figure in the Gallup article is interactive in that when you run your cursor over the graph, it highlights the year and corresponding values on all panels. The problem there is that I’m not convinced most people explore graphs this deeply, and I consider this information hidden, although not purposefully.
As you look at Figure 1, you will likely nod your head and say, Yeah, mental health, measured as the percentage of respondents that said their mental health was excellent, is still down after COVID. The thing is it isn’t entirely clear COVID is entirely to blame. I’m going to show two different versions of Figure 1.
First, in Figure 2, I simply added dots for the years and labeled all those years on the x-axis. The 2019 polling was before COVID, and we don’t have measurements until 2024, emphasized by the dots for the years. It is possible that responses went down farther and have rebounded, but we don’t have, say, a 2022 measurement.
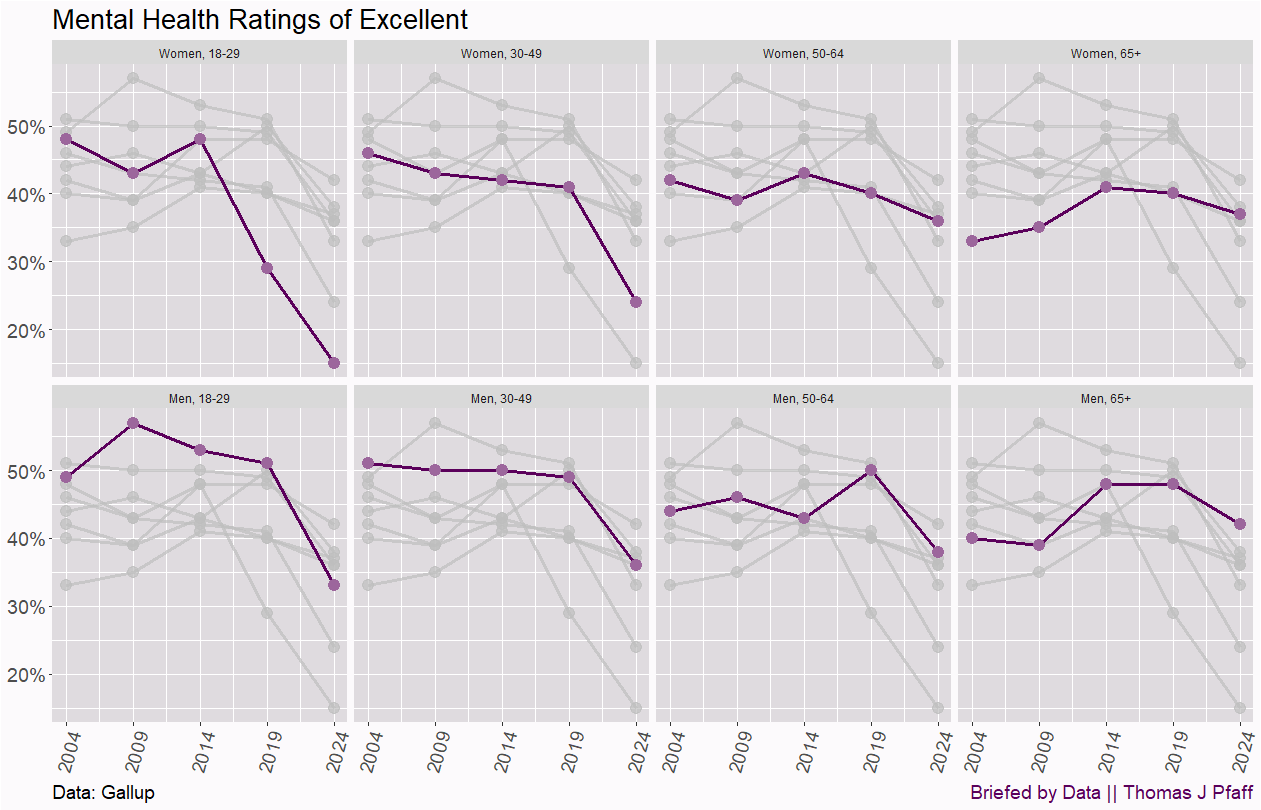
Worse, there are real sex differences here. For women, except for the 30-49 group, mental health started going down in 2014. There is also the problem of the 30-49 group including many of the previous 18-29-year-old women whose mental health started declining drastically in 2014. In fact, let’s emphasize this in Figure 3 and notice how I’m drawing your attention to information with a little color.
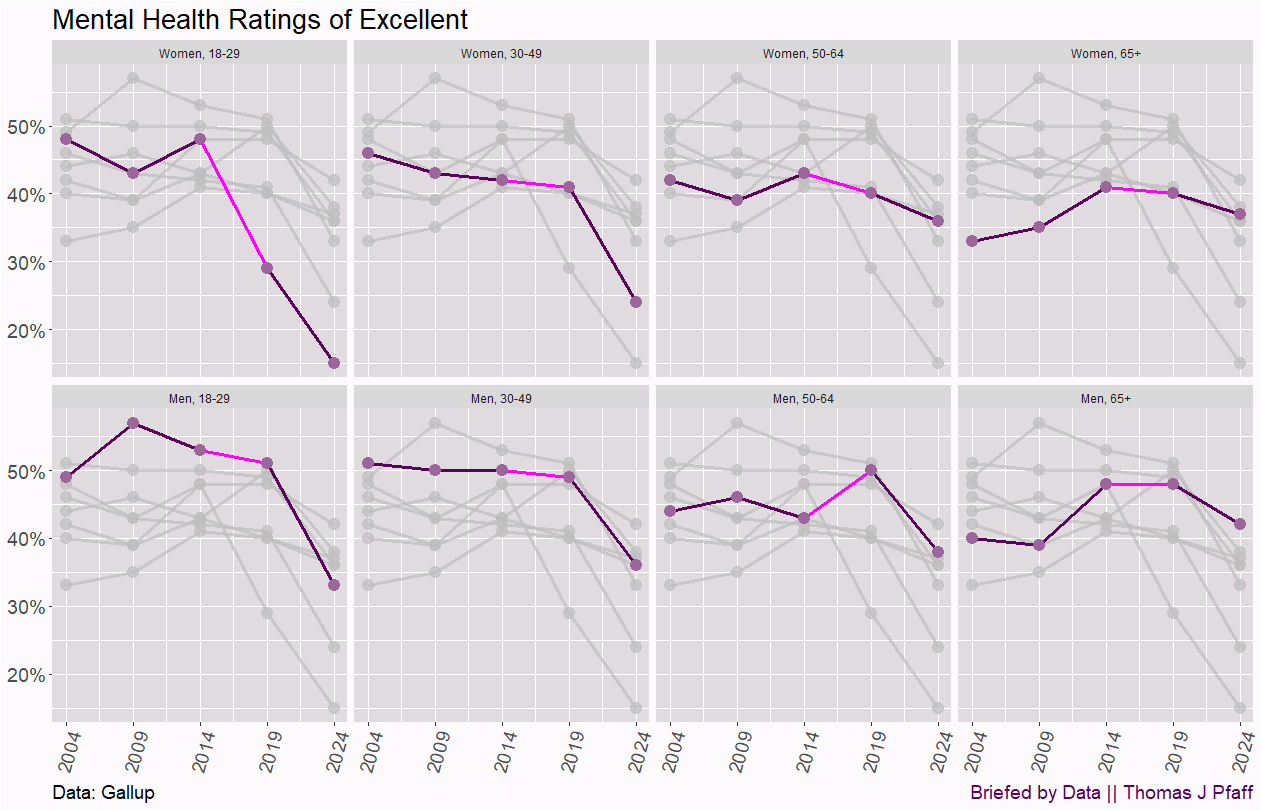
For women, except the 30-49 group, mental health started dropping before COVID, and 2024 looks more like a continuation of that trend. Can COVID really be blamed? The dropoff for 18-29-year-old women from 2014 to 2019 is bigger than the after. I think we have blamed a lot on COVID when COVID isn’t to blame, or at least certainly not entirely to blame.
For men, the story is different. The drop from 2019 to 2024 is not following the trend from 2014. It is hard for me to look at Figure 3 and not say (Data rule alert: Always consider other factors as single-factor explanations are rare.) that there are other factors at play because for women, trends started before COVID, and post-2019, there are notable differences between men and women. In fact, 65+ men, while down, are still above 2004. To see this, I made one more graph with this data, which is the percentage point change relative to 2004 in Figure 4. For example, if 2004 was 60% and 2024 was 50%, the value on the y-axis is 10.

In Figure 4 we see that the 65+ group is still above their 2014 measurement in 2024. For the 50-64 groups, they are down in 2024 compared to 2014 but by only 6 points or so. The drop for women 30-49 in 2024 is noticeable, but they had been going down every year, and so we would have to say at least some of that drop-off was expected and not entirely explained by COVID. Men 18-29 and 30-49 had a more noticeable drop in 2024. Women 18-29 dropped more in 2019 than in 2024 (keep in mind that we have to compare the added drop in 2024 relative to 2019). Something was already happening to young women by 2019.
In summary, this isn’t all COVID. It would be hard to say COVID had no impact, and I don’t think it had no impact. But if we as a society continue to suggest that this is all COVID, then we might think that eventually, when we get far enough away from COVID, everything will go back to normal. I think this is wrong, and we should wait 5 years for another Gallup article to say we haven’t recovered from COVID yet. I tend to agree with Jonathan Haidt at After Babel, who has made a case about the impacts of social media and smartphones and one of the factors here, and this Gallup data suggests that COVID isn’t the only or even the main factor in mental health declines.
Please share and like
Sharing and liking posts attracts new readers and boosts algorithm performance. I appreciate everything you do to support Briefed by Data.
Comments
Please let me know if you believe I expressed something incorrectly or misinterpreted the data. I'd rather know the truth and understand the world than be correct. I welcome comments and disagreement. We should all be forced to express our opinions and change our minds, but we should also know how to respectfully disagree and move on. Send me article ideas, feedback, or other thoughts at briefedbydata@substack.com.
Bio
I am a tenured mathematics professor at Ithaca College (PhD Math: Stochastic Processes, MS Applied Statistics, MS Math, BS Math, BS Exercise Science), and I consider myself an accidental academic (opinions are my own). I'm a gardener, drummer, rower, runner, inline skater, 46er, and R user. I’ve written the textbooks “R for College Mathematics and Statistics” and “Applied Calculus with R.” I welcome any collaborations.