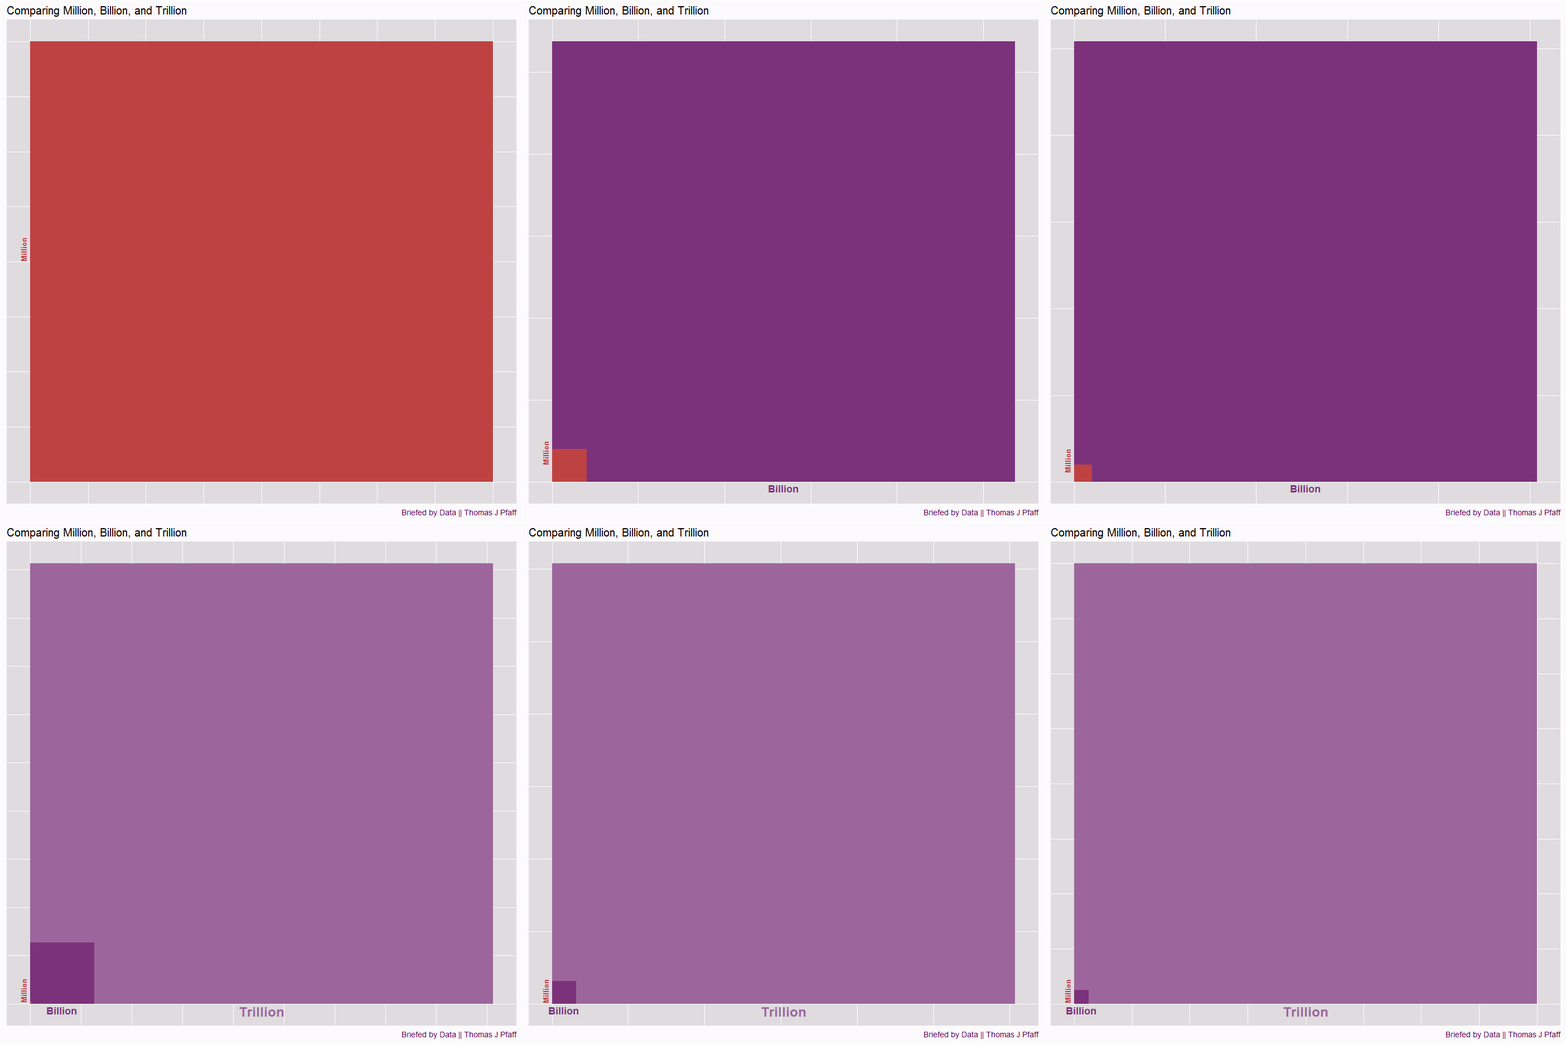
When the government misspends a million dollars, it is easy for the average person to be upset. A million dollars to us is a lot of money, but in fiscal year 2023, the U.S. government spent over 6 trillion dollars, and a million dollars isn’t much in a 6 trillion dollar budget.
To most of us, a million, a billion, and a trillion are all just large numbers, but there are differences in magnitude between the three. To help understand the difference, here is an animation comparing the three quantities.
The animation starts with an area of 1 million and then grows an area of 1 billion linearly, followed by growing an area of 1 trillion linearly. You can’t even see the million area square before the trillion area is done growing.
The R code that created this is at the end. If you enjoyed this animation, please consider sharing this post and subscribing (you can do it for free). Comments are welcome if you like the animation or have ideas on how to improve it.
Please share and like
Please help me find readers by forwarding this article to your friends (and even those who aren't your friends), sharing this post on social media, and clicking like. If you have any article ideas, feedback, or other views, please email me at briefedbydata@substack.com.
Thank you
In a crowded media market, it's hard to get people to read your work. I have a long way to go and I want to say thank you to everyone who has helped me find and attract subscribers.
R code
## Packages

library(dplyr)
library(tidyr)
library(ggplot2)
library(animation)

## Colors

MyRed <- "#be4242"
MyPurple <- "#5B005B"
MyLightP <- "#dfdbdf"
MyLightP2 <-  "#f8f4f8"
MyLightP3 <- "#fcfafc"
MyPurple3 <- "#7b327b"
MyPurple5 <-  "#9c669c"

## Data

StepN <-141

StepA <- data.frame(groupM = "Million",
                    valuesM = rep(1000, 141)
                    )

StepB <-  data.frame(groupB = "Billion",
                     valuesB = c(0, seq(1000, 31623, length.out = 70),
                                 rep(31623, 70) )
                     )


StepC <- data.frame(groupT="Trillion",
                    valuesT = c(rep(0, 71), seq(31623, 1000000, length.out = 70) )
                    )

data <- data.frame(StepA,StepB,StepC)

## Animation

saveGIF(
  {
   ani.options(interval = 0.20, nmax = 50)

   for (i in 1:StepN){

     Mrange <- max(data[i,2], data[i,4],data[i,6])
     Apt <- (Mrange/936)*4/3

     g1 <- ggplot(data[i,]) +
             geom_rect(aes(xmin = 0, xmax  =valuesT, ymin = 0, ymax = valuesT),
                           fill = MyPurple5) +
             geom_text(x = max( data[i, 6] / 2, data[75, 6] / 2), y = -12 * Apt,
                       label = "Trillion", fontface = 'bold', size = 8.5, color = MyPurple5) +
                 geom_rect(aes(xmin=0, xmax=valuesB, ymin=0, ymax=valuesB), fill = MyPurple3) +
             geom_text(x = max( data[i, 4] / 2, data[5, 4] / 2), y = -10 * Apt,
                       label = "Billion", fontface = 'bold', size = 6.5, color = MyPurple3) +
             geom_rect(aes(xmin = 0, xmax = valuesM, ymin = 0, ymax = valuesM), fill = MyRed) +
             geom_text(x = -10 * Apt,y = data[i, 2] / 2,label = 'Million', fontface = 'bold',
                       size = 4.5, color = MyRed, hjust = 0, angle = 90)+
             theme(plot.margin = unit(c(10, 10, 10, 10), "pt"),
                   axis.text = element_blank(),
                   axis.title = element_blank(),
                   plot.title = element_text(size = 20),
                   axis.ticks = element_blank(),
                   plot.background = element_rect(fill = MyLightP3),
                   panel.background = element_rect(fill = MyLightP),
                   legend.background = element_rect(fill = MyLightP2),
                   plot.caption = element_text(hjust = 1, size = 14, color = MyPurple)) +
             labs(title = "Comparing Million, Billion, and Trillion",
                  caption = c("Briefed by Data || Thomas J Pfaff"))

     plot(g1)
     ani.pause()
    }

    for (k in 1:10){
      print(g1)
      ani.pause() }

  }, movie.name = "Mill-Bill-Trill.gif", ani.width = 936, ani.height = 936)


Any tricks getting the R script to work? Been awhile since I played around with it and it can't find the packages. Installing a more recent version to see if that helps.