

QTRS April 9, 2026
Graphs, commentary, and interesting content for the curious
As I see it . . .
As I’ve been reflecting further on my Tuesday post, Should You Buy an EV Now?, I realize that it highlights one of my main issues with the degreed left, which is particularly frustrating, as I generally support many of the classically liberal causes.
The article I criticize has plenty of the “I’m smarter than you and so why aren’t you listening to me?” narrative that the left seems to increasingly use. It seems obvious to me that calling people stupid isn’t a successful strategy if you want them to support your cause or vote for you. Of course, the only people reading Noahpinion are ones that already agree with the article. In fact, this is true for almost all publications.
But, that’s not it or not only it. In the article examples are given of countries with increasing BEV adoptions. One was Singapore, which is about the size of NYC. The EU is another, but the EU has a rail system for longer travel that one might use a car for in the U.S. Norway is another example, but they fund the tax incentive to be a BEV primarily through oil revenue.
Norway’s approach to funding these green incentives is interesting: much of the funding comes from Norway’s Sovereign Wealth Fund, an almost $1trn (Nkr10.83trn) pot comprised almost entirely of oil and gas money.
In all cases, these countries are not a viable comparison to the U.S. or many other countries. This seems obvious, and anyone with some critical thinking skills would see this.
As I see it, one of the more frustrating aspects of the degreed left is that they talk a lot about education and how it teaches important critical thinking skills, yet they don’t seem to have these critical thinking skills. My Tuesday post this week is just one example. A post on the percentage of Americans who would benefit from a BEV, rather than assuming everyone should buy one, would be interesting. I doubt that percentage is very high. One has to have the money to pay the upfront cost, never want to take a road trip, and have a place to park the car at night with access to a charger.
I work at a college that has had declining undergraduate enrollment for a decade, and yet I regularly hear administrators say they are “hopeful” things will turn around. Hope isn’t a strategy, and it doesn’t demonstrate critical thinking.
We’ve had decades of climate activists talking about the dangers of climate change, but little in the way of achievable plans that will make a difference. Just stop oil isn’t a plan, and it isn’t critical thinking.
They are still suprised that Trump has won an election, twice, yet so far I’m not seeing any strategy aimed at convincing voters they are the better choice. A little critical thinking may be in order.
I could go on, but instead I’d like to hear your examples of the left’s inability to critically think.
Let’s go to some data.
What concerns Americans?
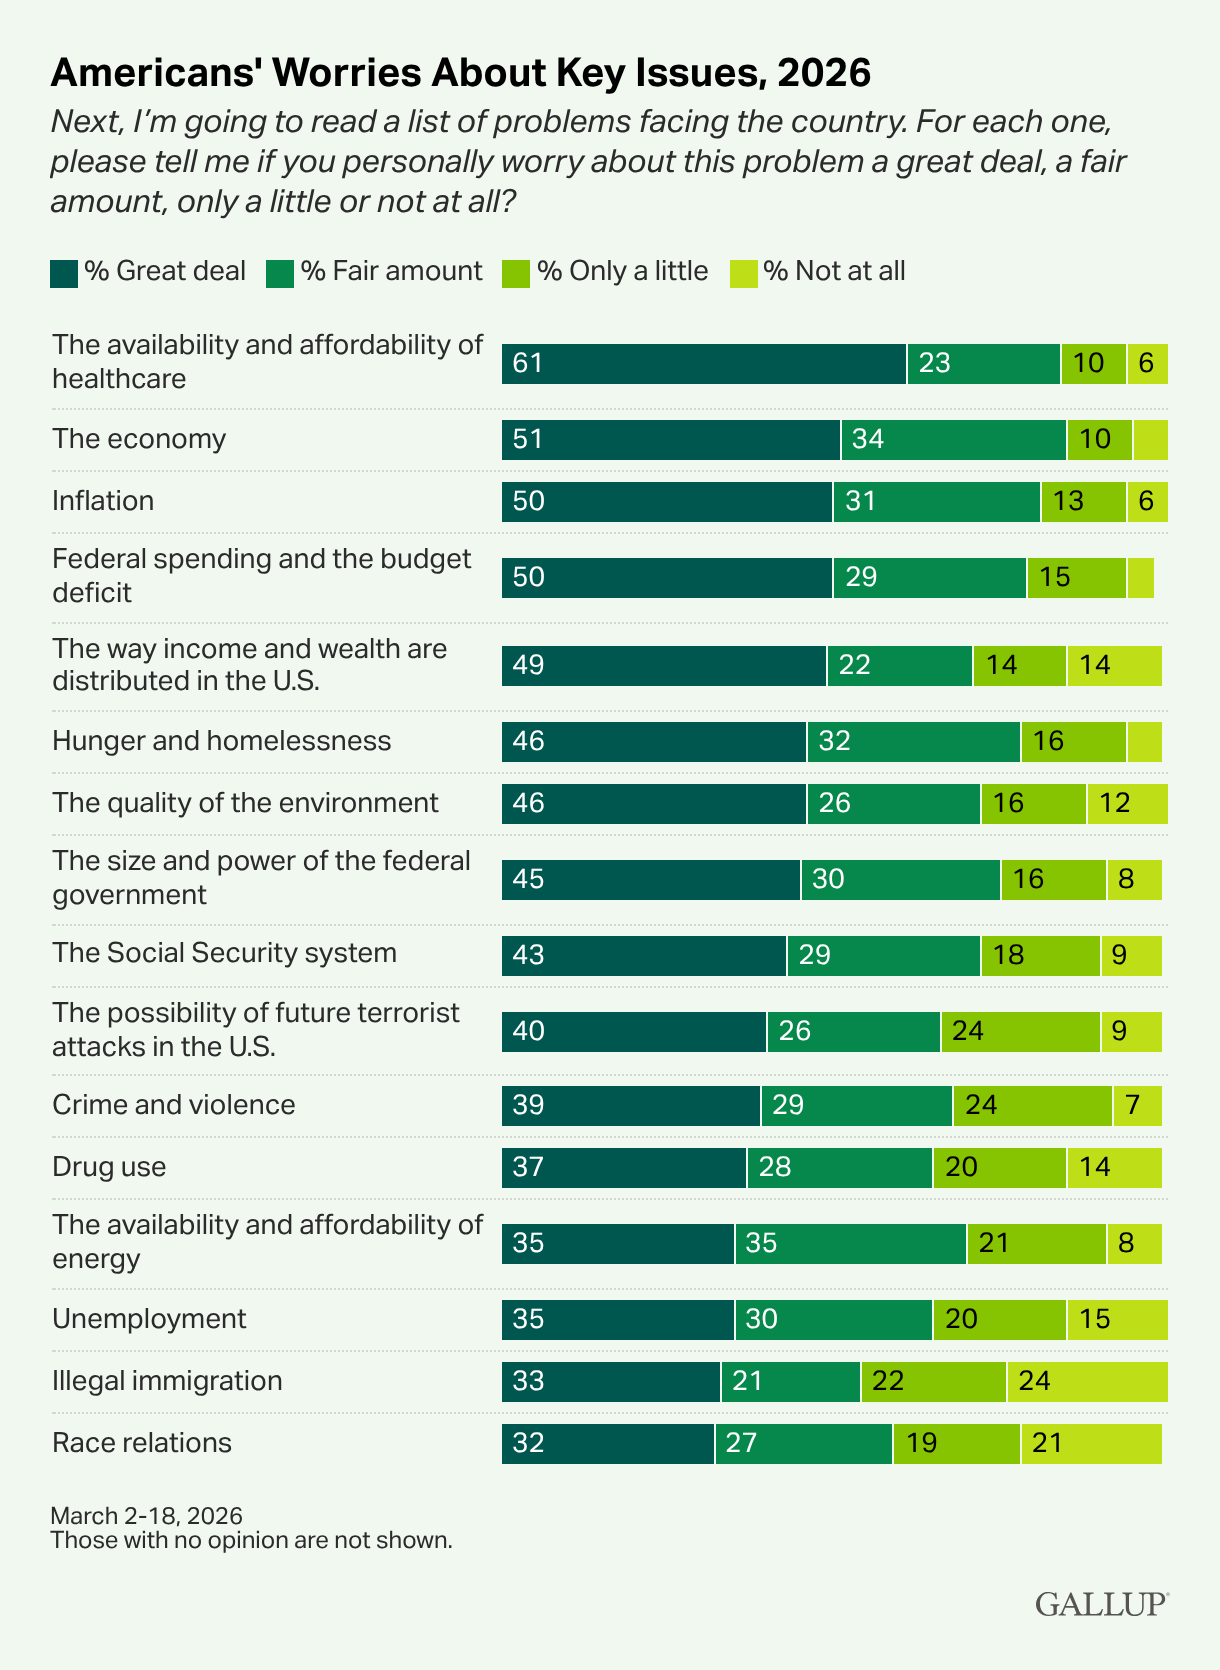
The Gallup article Healthcare Reclaims Top Spot Among U.S. Domestic Worries (3/31/2026) has some useful data. Two graphs worth copying here. If you want to win elections, healthcare is something you should talk about. Healthcare is one of the traditional liberal causes I support: some form of universal healthcare coverage. The left talks about it now and again, but after decades of it being an issue, they don’t seem to have a viable plan, and then they’d need to keep pushing it for years. To me, the easiest plan is to slowly expand Medicaid and Medicare.
How about working to move access to Medicare early, say, starting with age 60? How about an affordable buy-in for those that are self-employed, like general contractors or those in small companies? Instead of seeking an immediate change, gradually chip away at it. Meanwhile, note that race relations is at the bottom of the list. A little critical thinking here might help win elections.
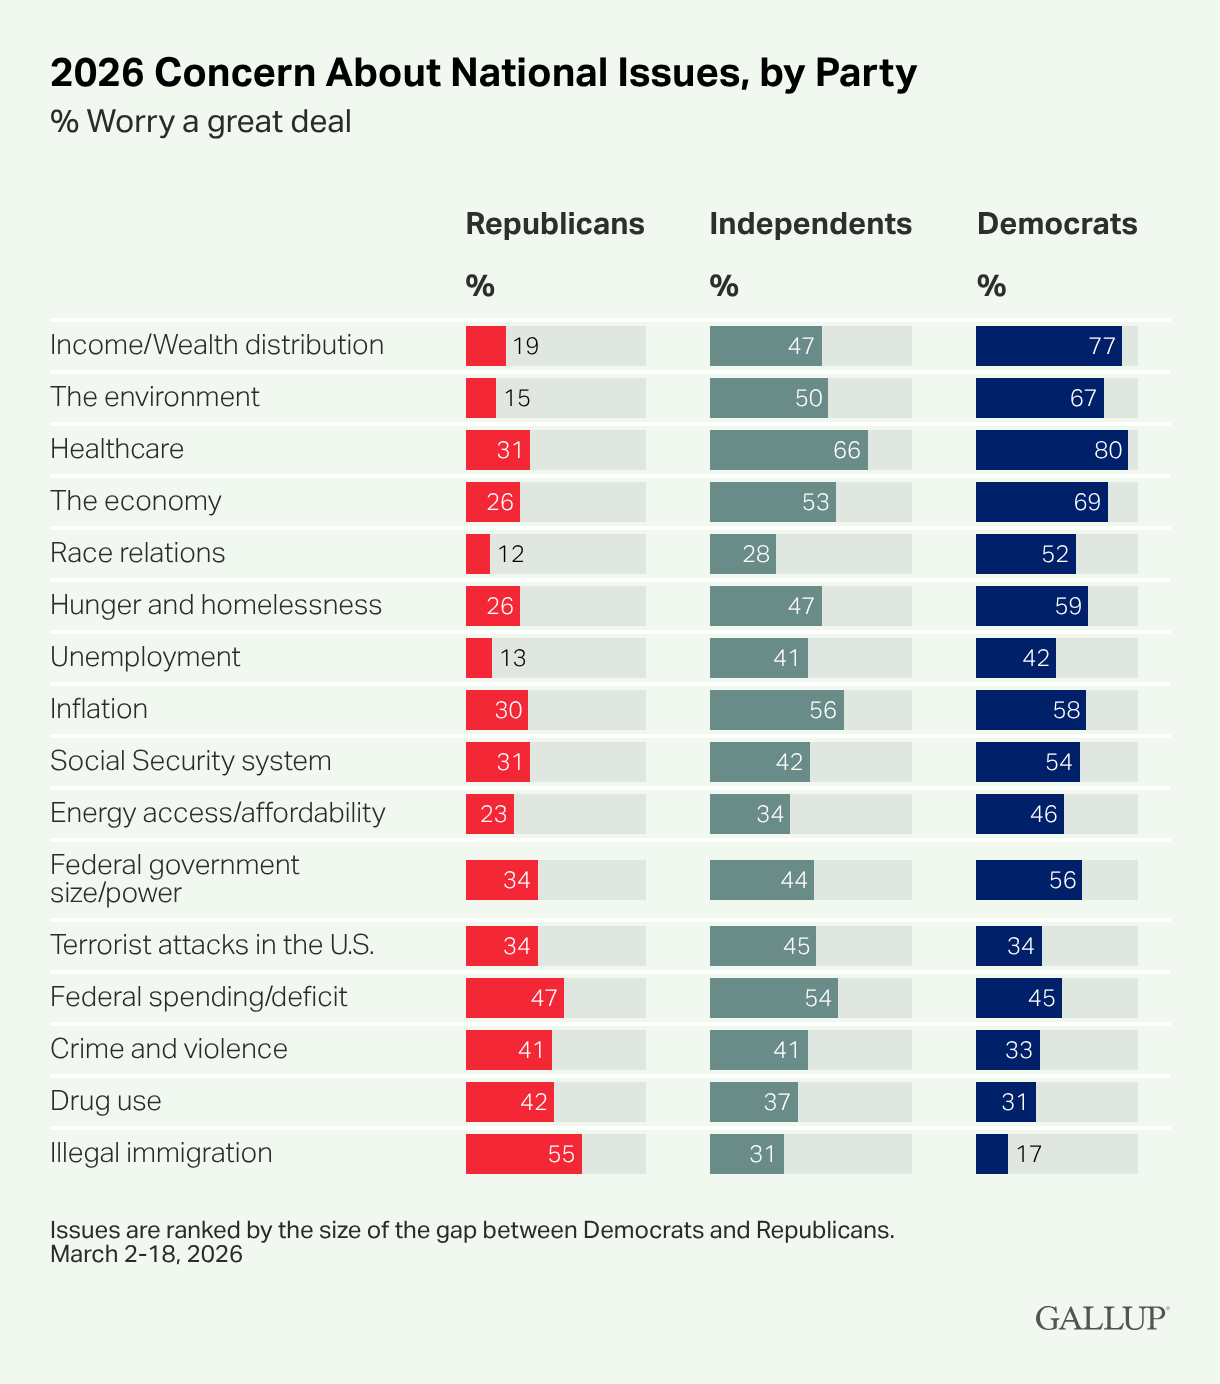
The second key graph is the breakdowns by party. Again, we seem to live in two different countries. Still, healthcare scores the highest for Democrats and independents, despite not being at the bottom of Republican concerns.
What I find most interesting is that Republicans don’t seem to worry a great deal, whereas over 50% of Democrats do on more than half the issues.
High state taxes and a bad graph
USAFacts has a terrible graph in their article Which states have the highest and lowest income tax? (3/25/2026). Here it is; do you see it?
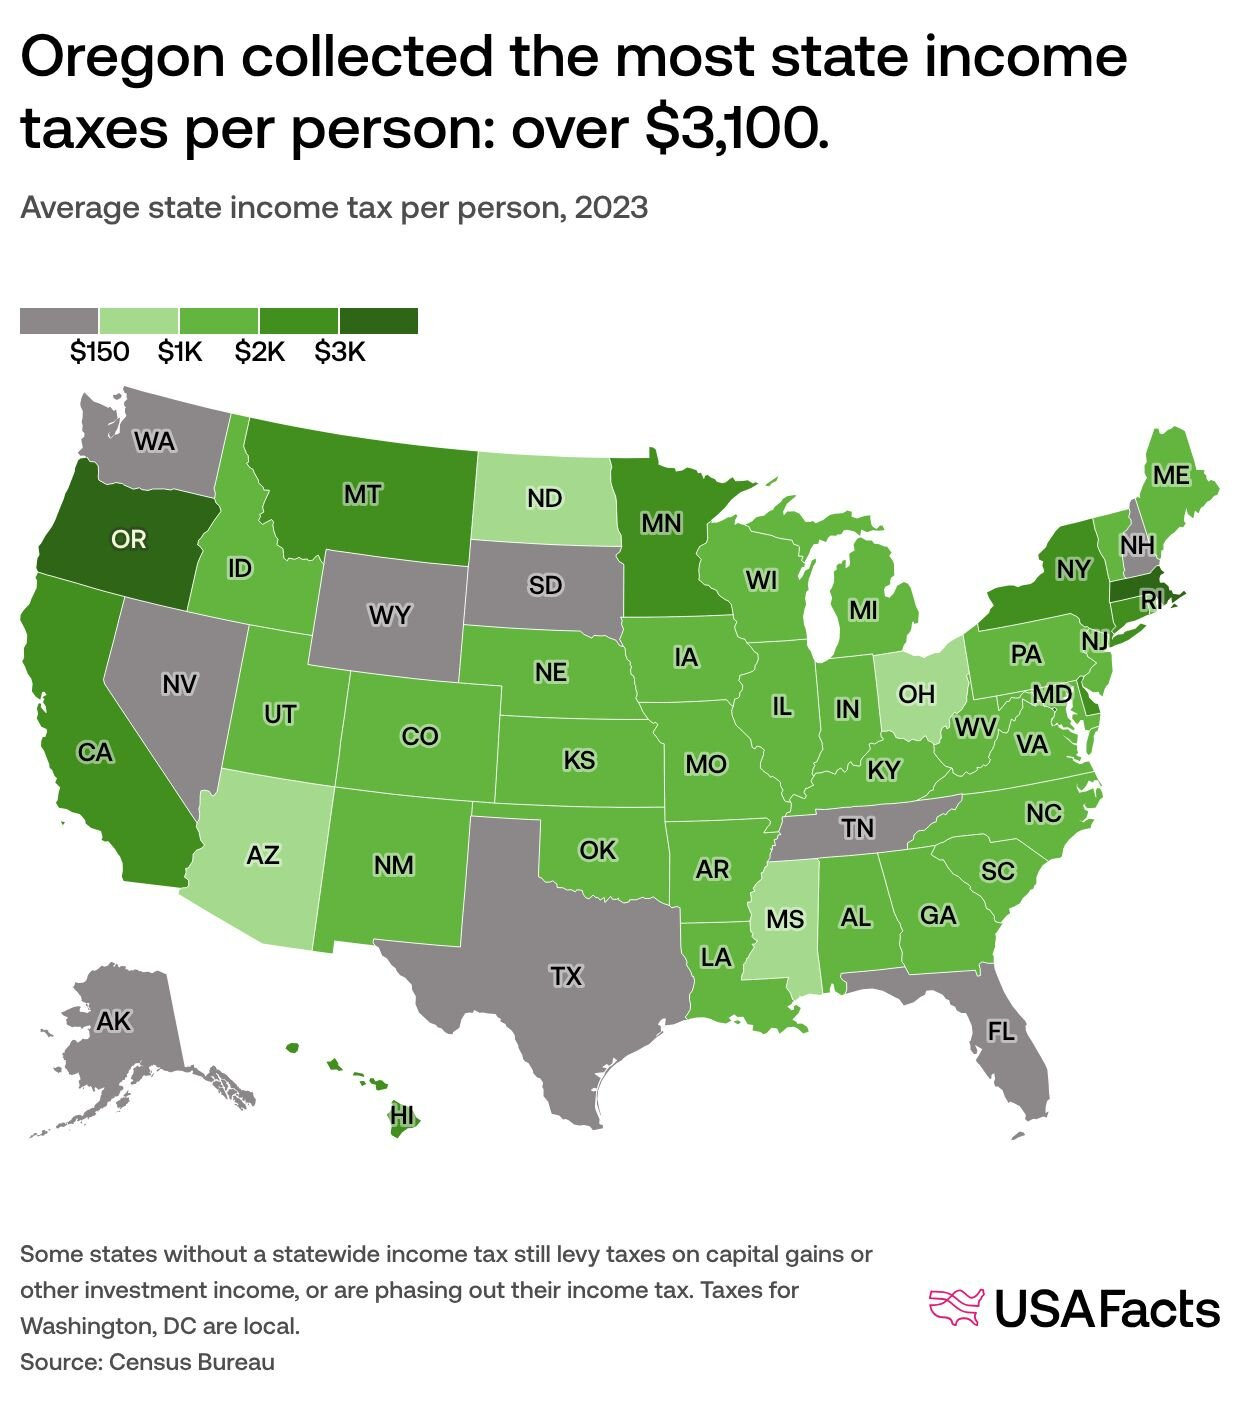
The data rule Normalize properly; ask, “Per what?” applies here. It makes no sense to have dollars as taxes paid by the state; you have to normalize to state incomes. One should not even produce this graph.
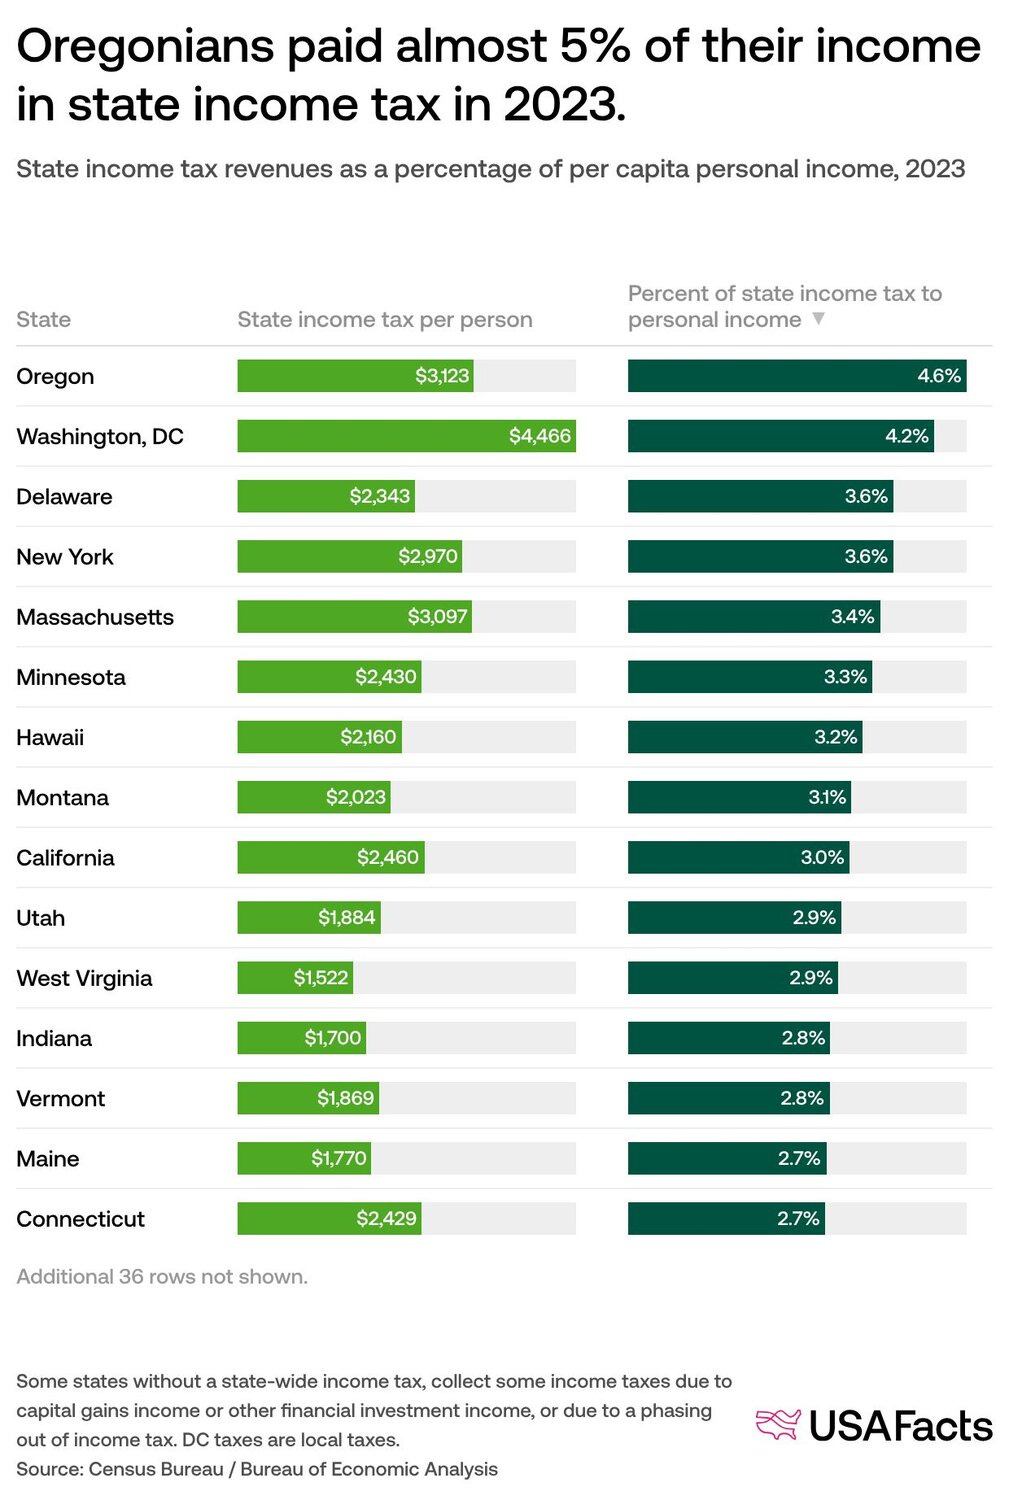
They make up for it a little with this table, but the map above should be with the data on the right side, percent of taxes, and not the left side, dollars paid. The article includes a table that shows all states if you are interested.
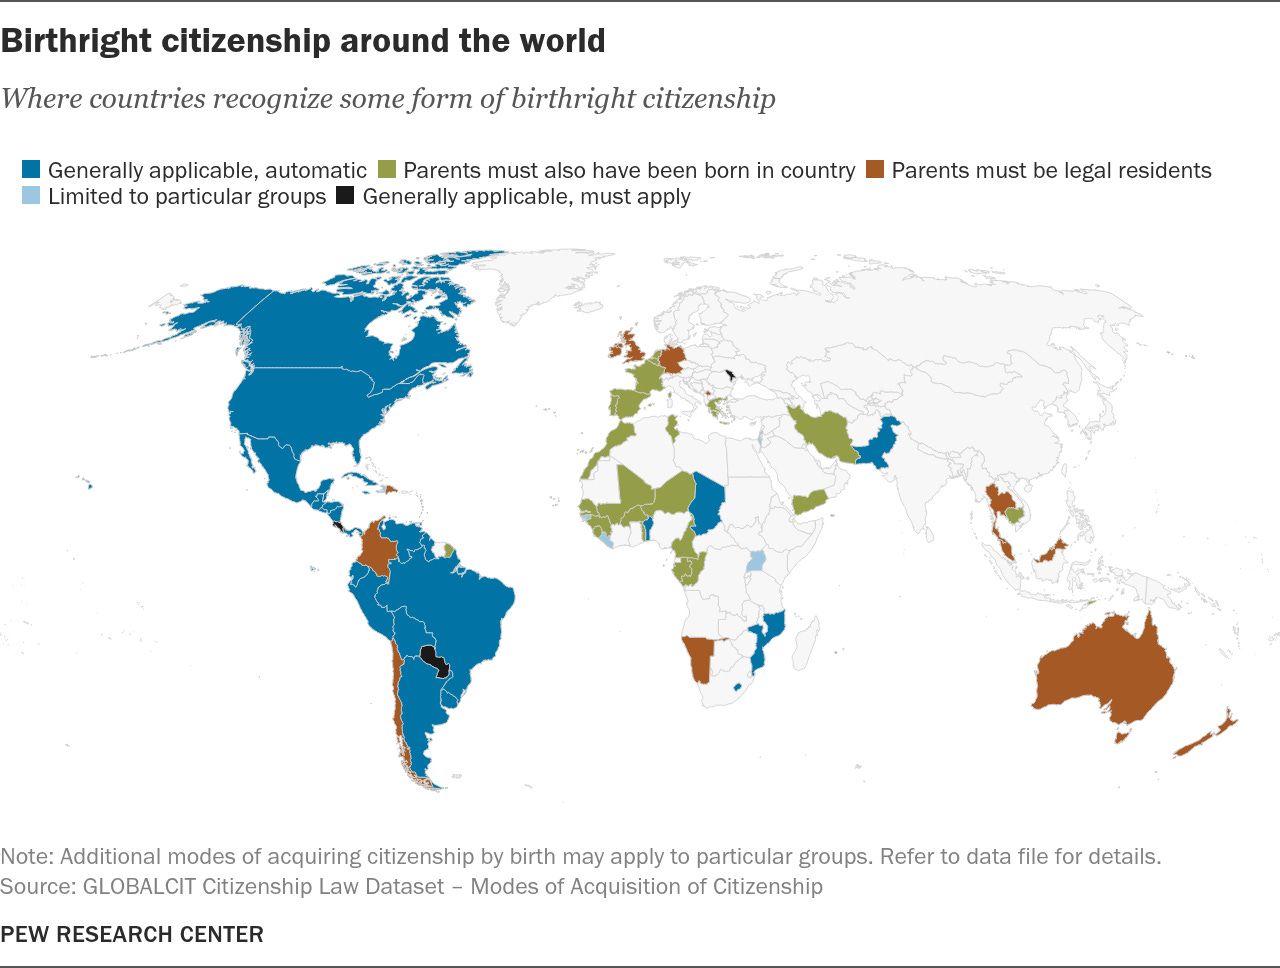
Birthright citizenship
Pew has an enlightening map in their article U.S.-style birthright citizenship is uncommon around the world (3/31/2026). Just an FYI, as I didn’t know this, and maybe you didn’t either.
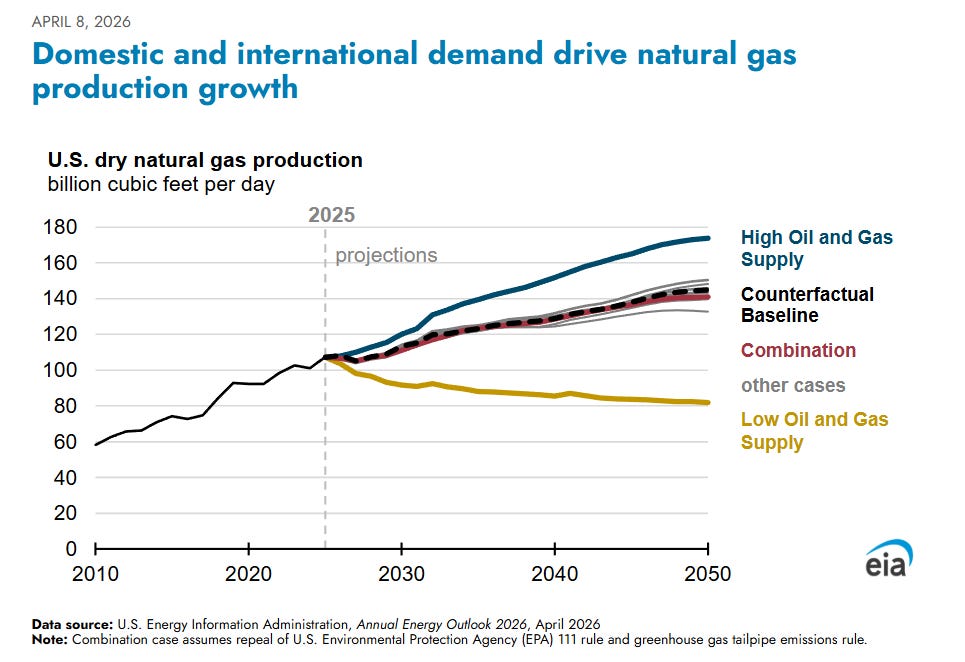
Natural gas projections
In all likelihood the U.S. will keep using more natural gas, according to the EIA.
Across most of our cases, we project U.S. dry natural gas production will increase by 20%–40% in 2050 compared to 2025. The Low Oil and Gas Supply and High Oil and Gas Supply cases, which fall outside of this range, demonstrate the impact resource assumptions have on our results.
Fun map
From the LOC (4/3/2026) with more in the article.
The big weakness of Wegener’s work was he could not account for the mechanism that allowed for continental drift. He proposed that the continents moved somehow due to the forces from the rotation of the earth, plowing through the ocean floor. Wegener tragically died in 1930 during an expedition crossing Greenland and so did not live to see his theories proven. It took several more decades for the majority of scientists to accept continental drift but to also discover its cause, what we now know as the theory of plate tectonics. An important contribution to this paradigm shift in thought was the work in the 1960s of Marie Tharp and Bruce Heezen in their mapping of the ocean floor and proof of seafloor spreading in the Mid-Atlantic Ridge. The 1994 map below depicts the intricacies of the world’s plates and movement, showing how far human understanding grew from Wegener’s initial 1912 proposal.

Data center update
Neocloud revenue exceeds $25bn in 2025. Reaches $9bn in Q4 2025, growth of 223 percent YoY. (4/7/2026)
The spinning CD
Please share and like
Sharing and liking posts attracts new readers and boosts algorithm performance. I appreciate everything you do to support Briefed by Data.
Comments
Please let me know if you think I expressed something incorrectly or misinterpreted the data. I would rather know the truth and understand the world than simply be correct. I welcome comments and disagreement. I encourage you to share article ideas, feedback, or any other thoughts at briefedbydata@substack.com.
Bio
I am a tenured mathematics professor at Ithaca College, holding a PhD in math (stochastic processes), an MS in applied statistics, an MS in math, a BS in math, and a BS in exercise science. I consider myself an accidental academic (opinions are my own). I am a gardener, drummer, rower, runner, inline skater, 46er, and R user. I’ve written the textbooks “R for College Mathematics and Statistics” and “Applied Calculus with R.” I welcome any collaborations, and I’m open to job offers (a full vita is available on my faculty page).