


QTRS August 8, 2024
Interesting content for the curious with lots of graphs

Um, oil is an energy source; a battery isn’t
I’m having a hard time taking RMI seriously. Here is graph from their article, The Battery Mineral Loop: The path from extraction to circularity (2024):

I get that they want to be optimistic and say that we can recycle most of the minerals in car batteries so that we don’t have to continue to extract them. I’ll ignore whether this is truly feasible or not and focus on this graph. The top bar for oil is, in fact, the energy that powers cars, trucks, etc. The bottom graph is the mineral demand to make the batteries. The batteries still need to be charged daily, or we could annualize that value. This comparison is nonsense, and I can’t imagine how many people have been misled by it. If you want to try this type of comparison, you need to add in the extraction for whatever system is being used to charge the batteries and deliver the electricity.
I want to reiterate that oil and coal are amazing substances. They are a form of stored energy that can be transported and used easily. Natural gas is also good but is a little more challenging to transport. On the other hand, wind and solar are ways to generate energy, but you then have to use it immediately or store it some way. Transportation is limited to power lines. Lithium batteries are a way to store energy.
If not the U.S., who?
The Pew article 72% of Americans say the U.S. used to be a good example of democracy, but isn’t anymore (7/10/2024) has this chart.
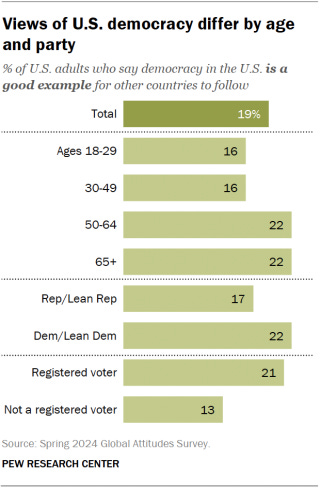
I guess the good news here is that team R and team D largely agree that the U.S. is a crappy democracy. I do wish that Pew would have asked a follow-up question on what country is a good example of democracy. Also, ask why they think we are a poor example of a democracy. We aren’t perfect, but we also aren’t that bad. Yeesh.
More headwinds for off-shore wind turbines
Robert Bryce continues his great work related to the hype around green energy. In his post, Breaking Wind, his subtitle should catch people’s attention:
The disintegration of the turbine blade and resultant pollution that forced the closure of Nantucket’s beaches should scuttle the offshore wind scam. But it’s only the tip of Big Wind’s problems.
Here are a couple of good quotes, but you should read the full article (bold mine).
But the disaster at Vineyard Wind — and it is a monumental disaster for the offshore wind industry — is spotlighting the environmental risks posed by installing dozens or even hundreds of massive wind turbines and offshore platforms in our oceans. This disaster happened in calm weather. It doesn’t take much effort to imagine what will happen when a hurricane hits the East Coast.
Sooner or later, a hurricane will come up the east coast, and climate change is increasing the odds of strong hurricanes. Off-shore wind farms aren’t easily fixed. Do we really want to depend on this energy?
So, how big are these turbines?
But here’s the critical part: its blades are 107 meters (351 feet) long and weigh 70 tons. In addition, the rotor of the massive machine spans 220 meters. For comparison, the wingspan of a Boeing 737 is 34 meters. In other words, the turbines at Vineyard Wind are nearly as tall as the Eiffel Tower and each of their blades weighs more than a fully loaded 737.
To make matters worse, it was about 48 hours from when the turbine started breaking and falling into the water and the company notifying anyone. Large debris like this floating on the water or just below the surface is a real danger to boaters, including the fishermen making a living on the water. One such person asks a great question:
He then asked a critical question that remains unanswered: “When this stuff is obsolete, who’s going to pay to remove it? They are talking about a total of 1,400 of these things.”
People who think there are free lunches continue to surprise me. Neither wind nor solar is a free lunch. There are no solutions, just trade-offs. We need to have honest conversations about the trade-offs otherwise.
From the gardens
Dahlia, hibiscus, Joe-Pye-weed, and roses.


Class is more of an issue than race
This is from the NBER working paper Changing Opportunity: Sociological Mechanisms Underlying Growing Class Gaps and Shrinking Race Gaps in Economic Mobility (July 2024). Bold mine.
Class gaps grew and race gaps shrank similarly for non-monetary outcomes such as educational attainment, standardized test scores, and mortality rates. Using a quasi-experimental design, we show that the divergent trends in economic mobility were caused by differential changes in childhood environments, as proxied by parental employment rates, within local communities defined by race, class, and childhood county. Outcomes improve across birth cohorts for children who grow up in communities with increasing parental employment rates, with larger effects for children who move to such communities at younger ages. Children’s outcomes are most strongly related to the parental employment rates of peers they are more likely to interact with, such as those in their own birth cohort, suggesting that the relationship between children’s outcomes and parental employment rates is mediated by social interaction.
Here is one of the many interesting graphs. Note the negative y-axis in the first graph. The bottom line is that the White class gap has grown while the White-Black gap has shrunk. The caption is below for more details.
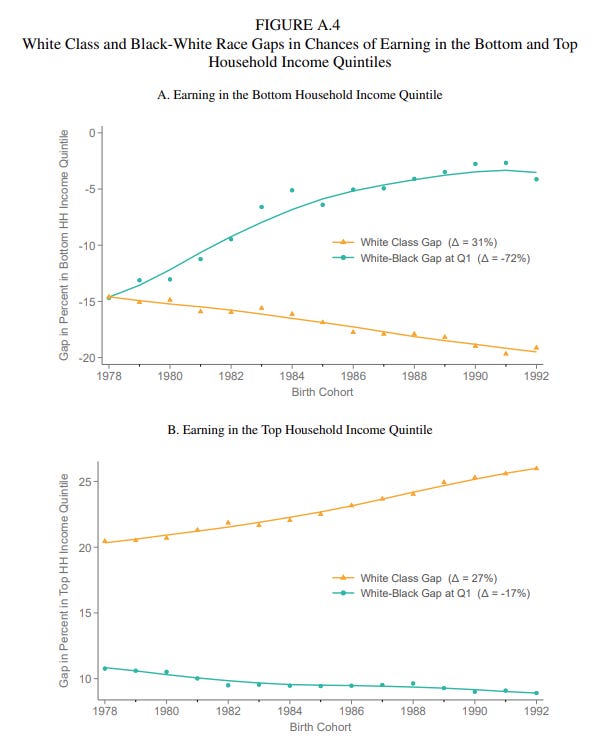
Here is the caption.
Notes: These figures plot the white class and white-Black race gaps for the chances of earning in the bottom and top household income quintiles. The white class gap is the difference between white children born to parents in the top versus bottom quintiles of the national income distribution. The white-Black race gap is the difference between white and Black children born to parents in the bottom quintile of the national income distribution. We also report the percentage change in the white class and white-Black race gaps between the 1978 and 1992 birth cohorts. We estimate each outcome using fitted values from a lowess regression on parental income quintiles for each race and birth cohort. We take the difference in these fitted values to compute the white class and white-Black race gaps. See Section II for details on the sample construction and variable definitions.
Investment in research is down
The AEI article Yes, America Underinvests in Public R&D notes that (7/20/204) (bold added to relate to chart—I think as the chart doesn’t have a legend)
Heading into the Great Pandemic, federal R&D spending was 0.6 percent of US GDP (orange curve) and 2.8 percent of total federal outlays (gray curve), the lowest in over 60 years.
This is an odd statement, as the orange curve was at a low point, not the gray curve. I give an A from the point that federal R&D spending should go back up. I give a D (maybe an F) for the graph since the two different curves are not clearly explained. In fact, I don’t think the gray curve is percent of GDP but percent of total federal outlays. I’m giving them the benefit of the doubt that the orange curve is correct information. If so, we should spend more as a country on R&D.

Everyone likes it when their team is in charge
This chart comes from the Gallup article Approval of U.S. Supreme Court Stalled Near Historical Low (7/30/2024). The current Supreme Court approval rate is 43%. In July 2016, it was 42%. The difference is which group approved of the court. The media will hype the low approval rating because Democrats aren’t happy. But today is not much different than in 2016, when the roles were reversed.

The next interesting thing here is that in June of 2005, it was also at 42%, but Democrats and Republicans both agreed. This seems to be a system problem. Our winner-take-all democracy would seem to encourage this polarization.
The spinning CD
Please share and like
Sharing and liking posts attracts new readers and boosts algorithm performance. Everything you do is appreciated.
Comments
Please point out if you think something was expressed wrongly or misinterpreted. I'd rather know the truth and understand the world than be correct. I welcome comments and disagreement. We should all be forced to express our opinions and change our minds, but we should also know how to respectfully disagree and move on. Send me article ideas, feedback, or other thoughts at briefedbydata@substack.com.
Bio
I am a tenured mathematics professor at Ithaca College (PhD Math: Stochastic Processes, MS Applied Statistics, MS Math, BS Math, BS Exercise Science), and I consider myself an accidental academic (opinions are my own). I'm a gardener, drummer, rower, runner, inline skater, 46er, and R user. I welcome any collaboration.