


QTRS Dec 26, 2024
Graphs and interesting content for the curious

If you enjoyed this content, please press the like button above and share it. This really helps spread the word about Briefed by Data. Of course, if you are not already a subscriber, please consider becoming one.
As we are in the holiday season, I’ll ask you to consider becoming a paid subscriber to Briefed by Data. Consider it a gift or tip to a favorite writer. I’d like to keep Briefed by Data free, but at the same time it is a fair amount of work.
As I see it…
As we are heading into resolution season, I think this quote comes from FS is relevant.
Stop trying to be spectacular. Start being consistent.
Your reputation isn't built on your best day. It's built on your worst. Warren Buffett's fortune was built on avoiding losses. Tom Brady became the GOAT not because of his highlight-reel throws, but because he rarely made a bad play.
Anyone can occasionally go to the gym, eat a healthy meal, and have a productive day. Doing it once in a while is common and doesn't mean much.
Moments don't make legends. Consistency does. And the hardest consistency isn't in doing brilliant things but avoiding stupid ones. Every mistake puts you in hard mode, forcing you to make up lost ground.
Anyone can do it once. The outliers do it often.
As I see it, consistency is an issue of avoiding procrastination. Here are my tips to help fight procrastination. I’ll use the analogy of going to the gym/exercising.
Do what you are likely to avoid doing first in the day. I exercise in the morning. The more tired you are later in the day, the easier it is to skip that day.
No zero days. Make sure you do at least a little something related to what you want to accomplish. Do at least part of that workout even if you don’t feel up to it.
The 10-minute rule. Starting something, especially if you don’t feel up to it, is the hard part. Even if you don’t think you have the time or energy to do everything you want to do, convince yourself to do at least 10 minutes. If you do that, you’ll likely do more than 10 minutes, as once we get started on something, we tend to keep going. Convince yourself to do 10 minutes of that workout, and you’ll probably complete it once you get going.
Let me know your tips in the comments.
Fertility rates
2.1 children per woman is the breakeven for population growth; below that and populatino decines, above that it grows. Most, I think all, wealthy countries are below that. In the U.S., even this has a political angle, as seen in these two graphs from the IFS article The Trump Bump: The Republican Fertility Advantage in 2024 (12/19/2024). Yes, putting Trump in the title is unnecessary and convinces about half the population to not read further. I wish they didn’t do this, but the data is still interesting, so read on.
The first graph shows fertility rate by county presidential voting. The more Republican the county, the higher the fertility rate, but all counties are well below 2.1. The 1.37 for mostly democratic counties is really astonishingly low.

The second graph shows that the relationship between political affiliation and fertility rate has increased, as seen with the increasing R2 values in the graph below. Note that in 2024 there are only about a dozen counties above 2.1. I see this as another example of how the U.S. is splitting into two very different groups.

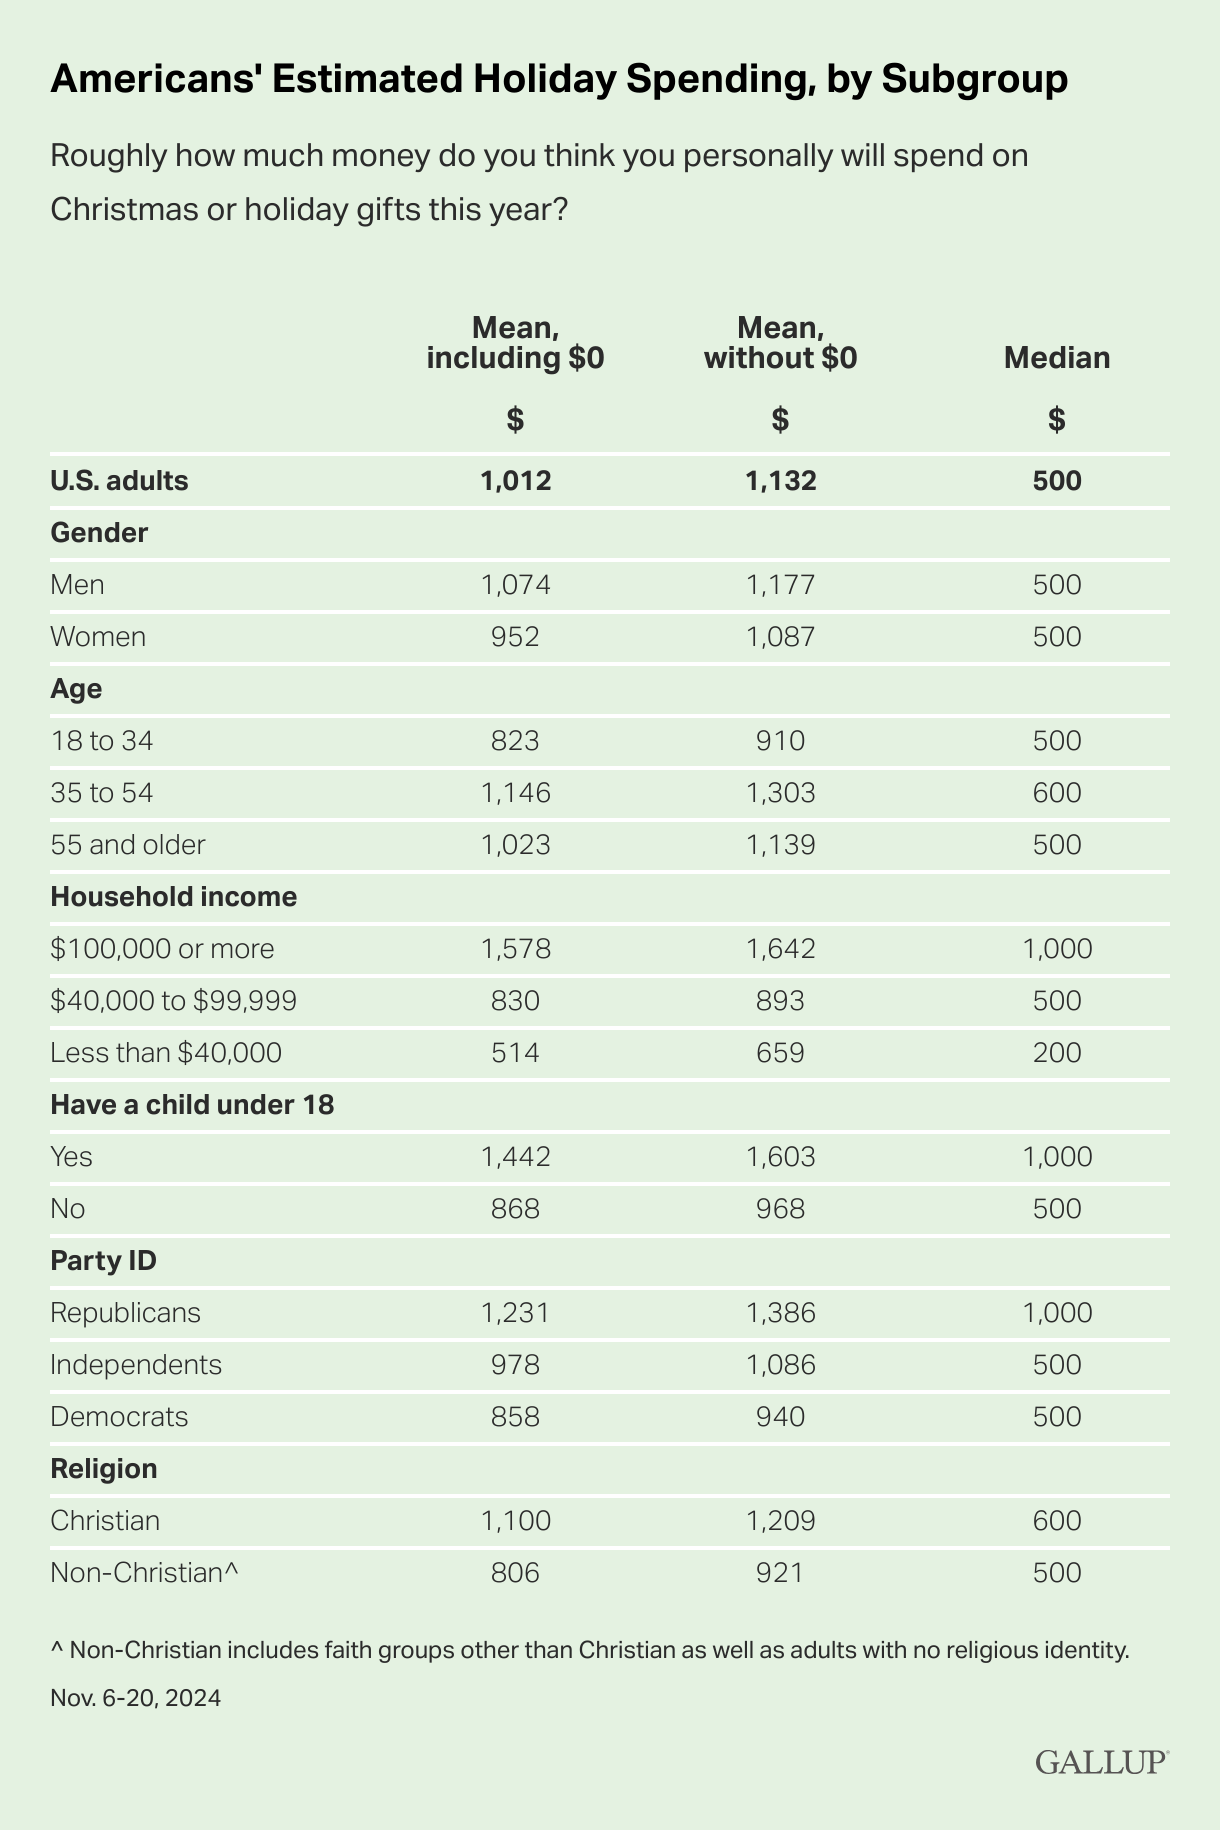
Holiday spending
When I first saw this graph from the Gallup article Shoppers Plan to Spend More Than $1,000 on Holiday Gifts (11/27/2024), I was going to poke fun at Democrats for being such cheapskates. The median spending of Democrats is $500, which is half that for Republicans. In the end, this chart is a good example of how grouping data like this can be decieving. As you saw above, Republicans tend to have more children, and their holiday spending is probably more aligned with having children under 18 grouping. It would be nice to have the data split up by political affiliation and children.
One key point here is that if you didn’t know that Republicans have more children, you wouldn’t know that the spending by political affiliation is influenced by this factor. This is something to keep in mind when drawing conclusions about simple data like this, as you should ask yourself what it is that I don’t know about this data and what other factors could be at play.
Now, why is it that men spend more on average than women? That seems unfair. For those teaching statistics classes, this is a great table with two means and the median.
Fasting and hair growth
I don’t have access to this article, but the title and abstract are worth noting: Fasting can reduce weight—but also hair growth. The dietary craze of intermittent fasting slows hair regrowth in both humans and mice, experiments show. (12/13/2024)
A popular weight-loss regimen stunts hair growth, data collected from mice and humans suggest1. The study’s findings show that intermittent fasting, which involves short bouts of food deprivation, triggers a stress response that can inhibit or even kill hair-follicle stem cells, which give rise to hair.
It would seem to me that generally triggering stress responses isn’t good, so maybe cuation is in order with intermittent fasting.
Sugar = bad?
While I’m reporting on health, here is one more: Early-life sugar intake affects chronic disease risk (11/19/2024).
The researchers found that early life exposure to rationing reduced the risk of diabetes and hypertension decades later. Risk declined with longer exposure to rationing, particularly for exposures longer than six months postnatally. People with the longest exposure to rationing had about 35% lower diabetes risk and 20% lower hypertension risk than people who were never exposed to rationing.
Studying nutrition is extremely difficult. Impacts are often long-term (think smoking), and it is really hard or even impossible to do experiments. For example, there aren’t any controlled experiments on smoking. You can’t randomly select participants, split them into 2 groups, and have on group smoke 2 pakcs a day for a couple of decades. This leaves observational studies to try to understand the impact of diet on health. It is hard to know if other variables are at play (consider the holiday spending example above). Hence, any one study should be taken with a grain of salt, but eveidene does pile up sometimes (again, think smoking). Sugar is starting to seem really bad.
As to the study, it is cleaver.
An NIH-funded research team led by Dr. Tadeja Gracner at the University of Southern California set out to study how exposure to sugar in utero and during infancy affects the later risk of diabetes and hypertension. To do so, they used a natural experiment: sugar rationing in the United Kingdom during and after World War II.
During rationing, the allotted amount of sugar was similar to current U.S. dietary guidelines: less than 40 grams per day for adults, less than 15 grams for children, and very limited amounts for children under 2 years. Sugar consumption nearly doubled immediately after rationing ended in September 1953.
Online grocery shopping
If you are like me, I find the instacart people at the grocery store annoying. I also don’t like that those that put in their order online have front row parking spots reserved, except for those with pyciscal challenges. So, I was interested in this graph from the USDA report Who Shops for Groceries Online? (Sept 2024).
A lot of these differences are likely tied to income, but the 28.9% of those with more than a bachelor’s degree jumps out to me. My take is that we don’t need more opportunities for the “elite” to avoid interacting with society at large. The ability of these folks to do common grocery shopping online, park in a close parking spot, pick up their groceries, and leave quickly just helps keep them in their bubble.

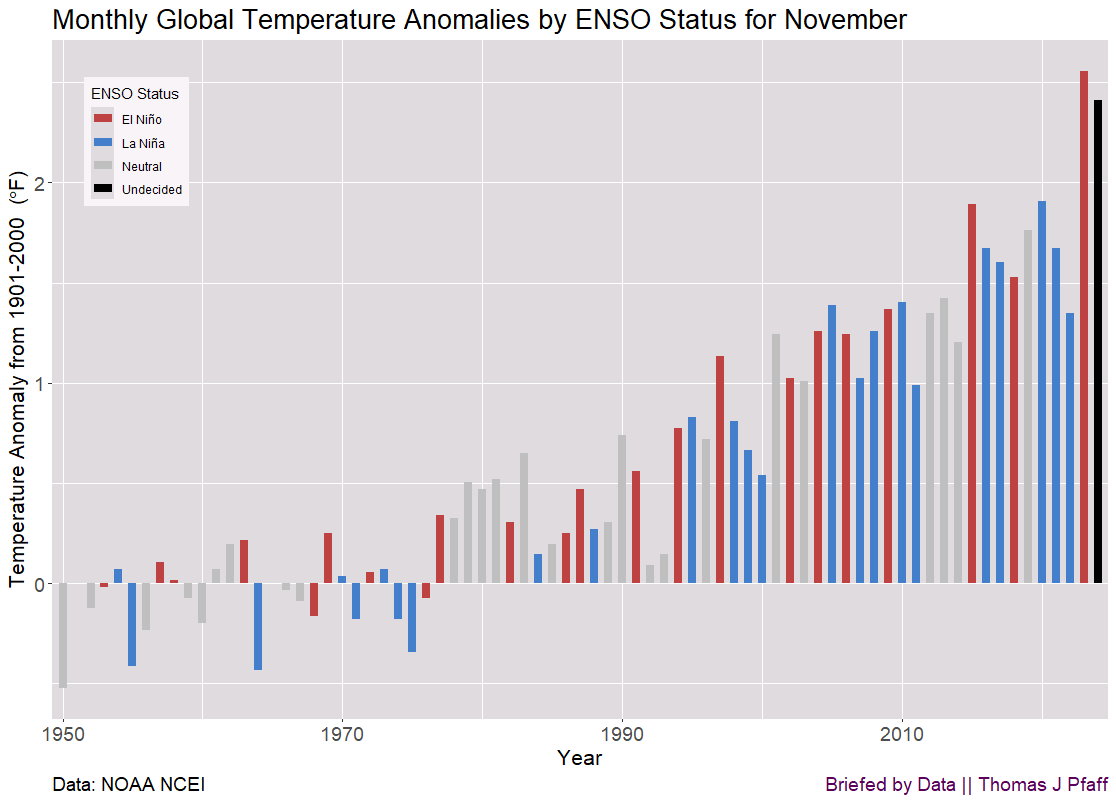
How hot was November 2024?
Here is the anomaly graph for November 2024 and the updated all-months graph. Officially, November will end up being a neutral month, and while the anomaly is lower than the recent El Niño anomalies, they do seem to be on the high side. Here is what NOAA has to say:
It was the second-warmest November for global ocean surface temperatures. These temperatures occurred under ENSO-neutral conditions. According to NOAA's Climate Prediction Center, weak La Niña conditions are most likely to emerge in November 2024–January 2025 (59% chance), with a transition to ENSO–neutral most likely by March–May 2025 (61% chance).

Data center projected electricity consumption
The Berkeley Lab report 2024 United States Data Center Energy Usage Report (Dec 2024) provides the graph and quotes below. In 4 years, they predict that data center electricity consumption will range from 6.7% to 12% of total electricity consumption in the U.S. We can’t add the demand of data centers and electric cars to the grid while at the same time satisfying this demand with wind and solar and replacing some of our fossil fuel electricity with wind and solar. In other words, we’ll keep emitting plenty of CO2.
In 2017, the overall server installed base started growing and Graphic Processing Unit (GPU)- accelerated servers for artificial intelligence (AI) became a significant enough portion of the data center server stock that total data center electricity use began to increase again, such that by 2018 data centers consumed about 76 TWh, representing 1.9% of total annual U.S. electricity consumption. U.S. data center energy use has continued to grow at an increasing rate, reaching 176 TWh by 2023, representing 4.4% of total U.S. electricity consumption.

Together, the scenario variations provide a range of total data center energy estimates, with the low and high end of roughly 325 and 580 TWh in 2028, as shown in Figure ES-1. Assuming an average capacity utilization rate of 50%, this annual energy use range would translate to a total power demand for data centers between 74 and 132 GW. This annual energy use also represents 6.7% to 12.0% of total U.S. electricity consumption forecasted for 2028.
The spinning CD
Please share and like
Sharing and liking posts attracts new readers and boosts algorithm performance. I appreciate everything you do to support Briefed by Data.
Comments
Please let me know if you believe I expressed something incorrectly or misinterpreted the data. I'd rather know the truth and understand the world than be correct. I welcome comments and disagreement. We should all be forced to express our opinions and change our minds, but we should also know how to respectfully disagree and move on. Send me article ideas, feedback, or other thoughts at briefedbydata@substack.com.
Bio
I am a tenured mathematics professor at Ithaca College (PhD Math: Stochastic Processes, MS Applied Statistics, MS Math, BS Math, BS Exercise Science), and I consider myself an accidental academic (opinions are my own). I'm a gardener, drummer, rower, runner, inline skater, 46er, and R user. I’ve written the textbooks “R for College Mathematics and Statistics” and “Applied Calculus with R.” I welcome any collaborations. I welcome any collaborations.