


QTRS Feb 13, 2025
Graphs and interesting content for the curious

As I see it…
As someone who deals in data, it is frustrating to see data misused, misunderstood, or ignored completely. At the same time, even people that use data don’t always fully understand what data tells us and what it doesn’t. Data doesn’t and shouldn’t always make decisions; it should only inform decisions.
As I see it, there is significant ambiguity regarding the transition from using data/facts to values in our decision-making. I talked about this in my stats class this week, and here are the examples I gave.
Gravity. This is pure fact. Regardless of your value or any beliefs you have, if you jump off a tall building, we can calculate how long you will fall and how hard you will hit the ground with great accuracy. Sometimes, data tells us everything.
Abortion. Here data tells us very little. Sure, we can say at what week a fetus is likely viable outside the womb. But by and large, one’s views on abortion are value decisions. The problem here is the framing of pro-choice vs. pro-life leads us to calling people anti-choice or anti-life. It now gets easy to demonize the other side. In reality, abortion is a value decision, and both sides have reasonable values. One side values the pregnant woman more than the fetus/future child. The other side values the fetus/future child more than the woman. Both of these are reasonable values. Neither side is evil or stupid. When we understand the value structure, maybe it becomes a little easier to find compromise between the two values as opposed to framing this as absolutes in pro-choice and pro-life. Europe has mostly been able to compromise here and move on.
Trans women in women's sports. Yes, I brought this up in class, but I think I was really careful, so far so good. If you read BbD, you may have seen the Female vs Male Grip Strength post (8/1/2023). Students in the class have used this data on assignments. The point here is that men are stronger than women. The differences, in fact, start very early in life (see below for another example); the data is clear. Yet, both sides here have reasonable value decisions. One side argues for the value of inclusivity and allowing trans women in women’s sports. The other values are the fair playing field that women’s sports exist for in the first place. The value arguments are clear, although you wouldn’t know it from the media.
My main issue in the debate is one side, inclusivity, framing the other side as transphobic. This also turns out to be a good example of data being ignored by one side. But again, if we focus on the values, it is easier to try to find compromise. The inclusive side’s value is reasonable, so how do we find opportunities for trans women without being unfair to women? That is what we should be discussing.
It was a quieter class than usual that day. It is a real shame because we aren’t teaching students how to even understand their own viewpoints, let alone understand their own viewpoint in a framework that allows for understanding the other side’s values, not demonizing the other side, and looking for compromise.
Before we get to data, a little break.
Fun photo
From the Library of Congress (1/30/2025). The post has other phone booth photos. One from an airport in 1981. The death of the phone booth isn’t that old and happened fast.

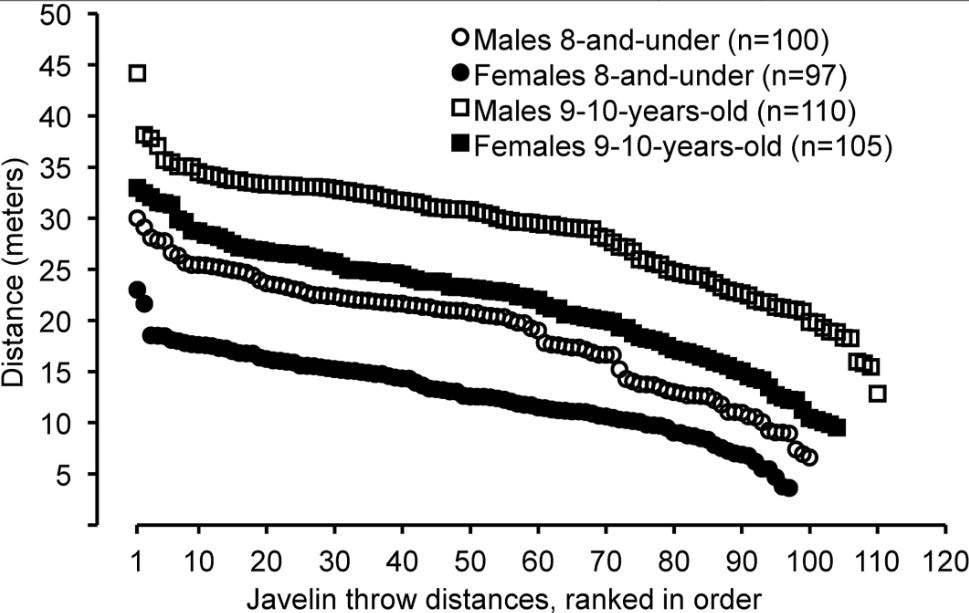
Sex differences in sports
Two papers from the last year in the European Journal of Sports Science on sex differences in sport at an early age have unsurprising results. The first is Sex-based differences in shot put, javelin throw, and long jump in 8-and-under and 9–10-year-old athletes (12/14/2024). Here is the graph for the javelin (biggest differences).
The data is for the “top 8 performances in the 8-and-under and in the 9–10-year-old age groups from the USA Track and Field National Youth Outdoor Championships and the USA Track and Field National Junior Olympic Championships during the years 2016–2023” (excluding 2020).
Javelin throw distances for 8-and-under males (19.00 ± 5.64 m) were 32.6% farther (P < 0.0001 and Hedges’ g = 1.269) than for 8-and-under females (12.81 ± 3.94 m).
Javelin throw distances for 9–10-year-old males (28.57 ± 5.74 m) were 23.5% farther (P < 0.0001 and Hedges’ g = 1.169) than for 9–10-year-old females (27.87 ± 5.72 m).
The second is the paper Sex-based differences in track running distances of 100, 200, 400, 800, and 1500m in the 8 and under and 9–10-year-old age groups (2/5/2024).
The data is from the same source. Here is one excerpt of results.
Finishing times in the 100-m race for the 9–10-year-old males (13.78 ± 0.67 s) were faster (p = 0.000; Hedges' g = 0.584) than for the 9–10-year-old females (14.18 ± 0.70 s). The range of finishing times in the 100-m race for the 9–10-year-old males was 12.55–16.77 s (Figure 1, upper panel), while the range for the 9–10-year-old females was 12.84–16.40 s. Seven males in the 9–10-year-old age group had faster 100m finishing times than the fastest female in the 9–10-year-old age group.

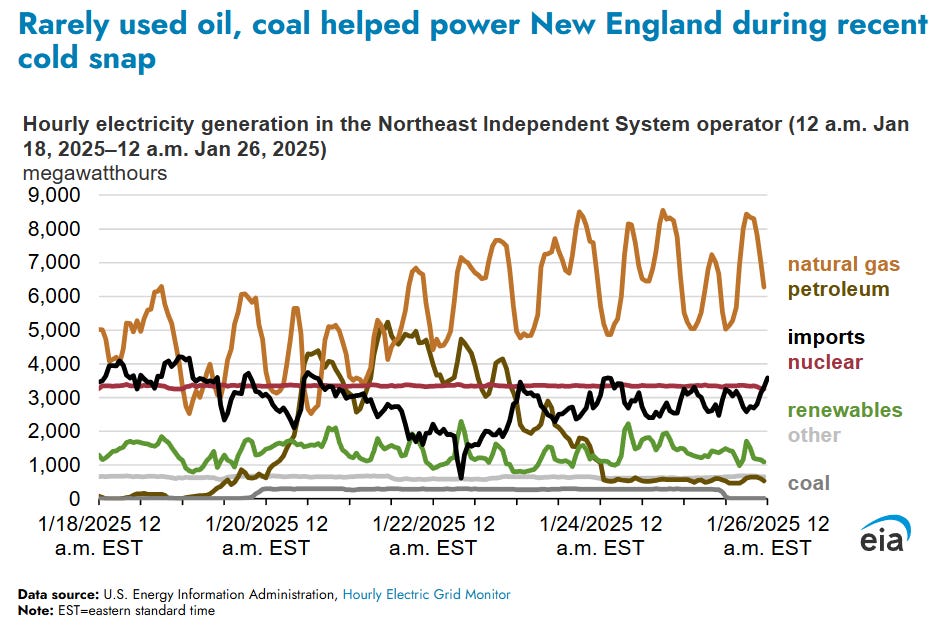
Another issue with renewables
This is from the eia (2/5/2025), and you want to focus on the dark brown line. That is petroleum, and we had to spike its use to keep the lights and heat in the Northeast. This wasn’t for a couple of hours but for about 4 days. Battery backups aren’t going to do that for us. A 100% wind and solar grid isn’t feasible without fossil fuel backup systems.
Related to this is the propaganda piece written by the Climate Brink (2/12/2025). Here is the title and subtitle: No, renewables don't need expensive backup power on today's grids. The actual story is the opposite: renewable energy pushes the most expensive fossil fuel plants out of business, lowering costs for consumers.
Most of the comments are more valuable than the one-sided post. The point here is that renewables mostly don’t need expensive backups because they are only a small part of the grid. But notice in the eia graph that we did need a backup for the grid.
Although the grid had sufficient generating capacity to satisfy demand, a significant share of that supply came from sources that rarely operate. The grid required running older thermal generating plants that burn oil and coal. Between the hours of 11:00 a.m. and 4:00 p.m. eastern time on January 20, 2025, and between the hours of 10:00 a.m. and 1:00 p.m. on January 21, 2025, thermal plants that burn oil provided more electricity to the ISO-NE electricity grid than plants that burn natural gas, which is relatively uncommon.
We also had to import energy
Two other major sources of electricity in New England were steady suppliers during the cold snap. The region’s three nuclear reactors steadily provided 3,350 MW of power throughout the period, joined by consistent imports of power from Canada. At 11:00 p.m. on January 18, imports of electricity from Canada surpassed 4,200 MW and averaged 2,886 MW per hour between midnight on January 18 and midnight on January 26.
What about prices? This is from the eia New England Dashboard. I’m not sure if New England prices relate exactly to Northeast usage, but it must be close. In one week's time, from Jan 13 to Jan 20, the heavy load hours pricing went from under $100 per megawatthour to around $225. Bottom line, any infrastructure that is kept around to be used only once in a while is going to charge a lot to pay the bills to keep it around all year.

If renewables are a small part of the grid, this isn’t a big problem. But this example shows that renewables, if they were a larger part of the grid supply, would need significant backup capacity, and that will cost. I suppose one could argue that renewables would be so cheap all year that the occasional price spike would still leave average prices lower. If so, then try and make it. I don’t buy it, but stop pretending it doesn’t matter. We want and, in some ways, need a grid that can handle consistent and growing baseloads and spikes on demand. Wind and solar power are insufficient, despite their ability to add some load.
Graph of the week
This is the second graph from the paper Human Footprint and Forest Disturbance Reduce Space Use of Brown Bears (Ursus arctos) Across Europe (1/3/2025). From the abstract:
We found large intraspecific variation in brown bear space use across all scales, which was profoundly affected by human footprint index, vegetation productivity, and recent forest disturbances creating opportunity for resource pulses. Bears occupied smaller home ranges and moved less in more anthropized landscapes and in areas with higher resource availability and predictability. Forest disturbances reduced space use while contiguous forest cover promoted longer daily movements.
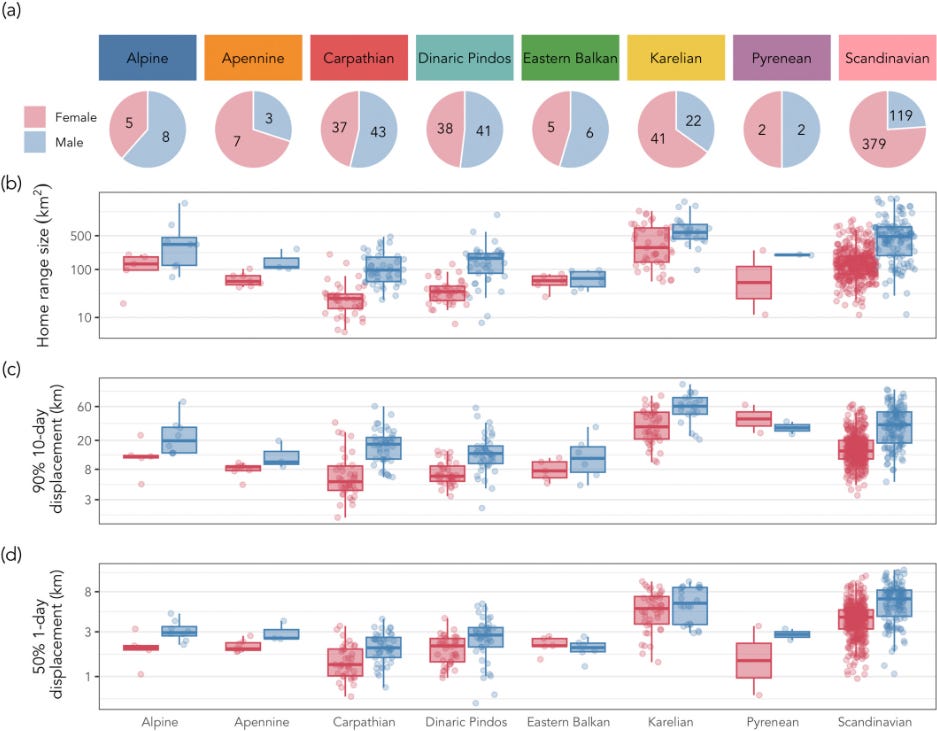
The 1-day category is a measure of daily movement, while the 10-day represents longer movements. I find it amusing that they made boxplots with 2 data points. Still, this is a well-done graph.
Male drug overdoses
The aibm article The New Race Gap in Drug Overdose Deaths: The Rising Toll on Black Men (2/3/2025) has four interesting graphs. Here is the first one. I’ll note the order is the same as usual. Asians are doing better than other groups, and Blacks generally the worst. White and Hispanic are in the middle, but the orders I see are not always the same.

The spinning CD
Please share and like
Sharing and liking posts attracts new readers and boosts algorithm performance. I appreciate everything you do to support Briefed by Data.
Comments
Please let me know if you believe I expressed something incorrectly or misinterpreted the data. I'd rather know the truth and understand the world than be correct. I welcome comments and disagreement. We should all be forced to express our opinions and change our minds, but we should also know how to respectfully disagree and move on. Send me article ideas, feedback, or other thoughts at briefedbydata@substack.com.
Bio
I am a tenured mathematics professor at Ithaca College (PhD Math: Stochastic Processes, MS Applied Statistics, MS Math, BS Math, BS Exercise Science), and I consider myself an accidental academic (opinions are my own). I'm a gardener, drummer, rower, runner, inline skater, 46er, and R user. I’ve written the textbooks “R for College Mathematics and Statistics” and “Applied Calculus with R.” I welcome any collaborations. I welcome any collaborations.