


QTRS Feb 6, 2025
Graphs and interesting content for the curious

As I see it…
If you took an introductory statistics course, you should have been taught about type I and type II errors: rejecting the null when you shouldn’t or accepting it when you shouldn’t. If nothing else changes, you can’t reduce both errors, and as one goes down, the other goes up. This is a framework that should be more widely used to understand choices. Our legal system prefers to reduce type I errors. For example, if a person is on trial for murder, there are two possible errors. The person is not guilty but is found guilty, or the person is guilty but found innocent. Our system of innocent until proven guilty is set up to reduce the error of not guilty people in prison, but that means there are more guilty people found innocent. At the risk of a few more unsubscribes, although I’d much prefer dialogue in comments...
As I see it, both sides of the housing trans women inmates need to stop ignoring or minimizing one of the two errors. If all trans-identifying women get to be in women's prisons, there will be and have been sexual assaults against women. On the other hand, if all trans-identifying women are housed in men’s prisons, there will be and have been sexual assaults against them. This is a type I, type II error situation. If both sides are going to be absolutist, then the issue becomes which error do you favor? Do we simply pick the policy with fewer sexual assaults? Or, do we recognize that maybe the absolutist stance is part of the problem? I think when you step back and think about the two errors, it provides for a way to think about and focus on the problem that might lead to better outcomes, and yes, there is more nuance here than just this. Now, I’m assuming we can all agree that sexual assaults in prison are bad, so how do we minimize them? Make decisions on housing on a case-by-case basis? A separate prison for trans women? Something I haven’t thought about? Step back from the ideological stances, consider the errors, and look for better solutions; heck, maybe even compromise a little.
Let’s go to some data, although I recognize that any transition here might be a bit harsh.
Higher education president’s poll
Inside Higher Ed (2/6/2025) reports on a president poll with this graphic. It was done after Trump was elected but before he took office. It is interesting, but I’m not sure how serious I should take it. Take a look, and I’ll comment after the graph.

Here are four problems I have.
College presidents are anything but politically unbiased, so I take all responses with that in mind.
In the questions that ask about higher ed in general and at their institution, we see an I’m fine, but everyone else isn’t response. 58% say the climate for DEI across higher education will see a significant negative impact, but only 37% at the home institution. For civil dialogue, it is 31% vs. 19%. These splits shouldn’t be so far apart.
The four questions that start out as “The climate for” are poorly worded and speak to the bias of the survey. What is really being asked of here, and why does it matter? Why not ask clearer questions about outcomes for minority students, for example? Which leads me to my final point.
Despite all the negativity on the climate-related questions, there are really only two questions that matter. Can they carry out their mission? Only 6% said this would be significantly negatively impacted. Only 4% said the financial outlook at their institution would be significantly negatively impacted. I think it is fair to question how important the climate questions are to higher ed. If they were really important to the mission and/or finances, it would seem that the spread wouldn’t be so great.
I focused on significant negative impact because somewhat seems a bit wishy-washy, but most of what I said is the same if we put significant and somewhat together.
Use it or sell it
I would bet on the fact that any country with fossil fuels will extract them and either use them or sell them. The U.S. has been using more natural gas for electricity and so has been increasing coal exports since 2018. (eia 2/4/2025)
Gross U.S. coal exports in June 2024 totaled 10 million short tons, the most in a month since October 2018, data from our Short-Term Energy Outlook data browser show. Annual average U.S. coal exports were 9.0 million short tons in 2024. U.S. coal exports have increased each year since 2020, when they averaged 5.8 million short tons amid the COVID-19 pandemic.

Upgrading the grid or not
From DCD (2/3/2025):
In late 2021, the Federal Energy Regulatory Commission (FERC) directed all six major regional operators outside of Texas to establish programs to implement a system for dynamically updating transmission line capacity ratings based on real-time weather conditions.
The idea here is that by knowing the temperature of the lines “capacity of existing lines by up to 40 percent.” This was supposed to be done by July 2025. All six of the operators need extensions. Why does this matter?
The delay could have significant implications for the country’s data center market, which is projected to grow by at least 65GW and as much as 90GW by 2029, according to Grid Strategies.
This may be one reason why data centers are looking to secure their own source of electricity.
Spending on clothes
I doubt anyone would be surprised that women spend more money on clothes than men, but how much more? Can you guess? The BLS (2/5/2025) has the answer in the chart below. The fact that made me pause is that more money is spent on boys, ages 2-15, than girls, $96 per year to $87 per year. My guess as to why is the boys trash their clothes faster than girls.

Graph of the week
This comes from the paper Future climate and land use changes challenge current dependencies on wild food harvesting by rural indigenous communities (Dec 2024). The tan map in A is the Republic of Sakha (eastern part of Russia; the blue is water). The graph is C given the percentage of dietary share of that food group that is wild at one of the 18 locations noted in the map.
Two takeaways. The first is that there are still populations that depend heavily on wild harvesting of food locally. Second, it’s just a well-done graph with lots of information.
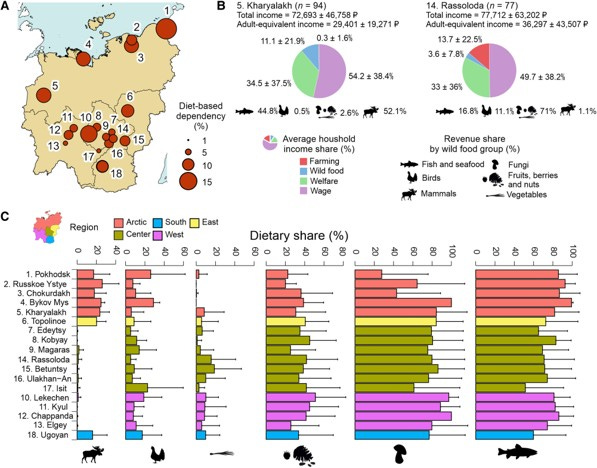
Caption:
Dependency on wild harvesting of households from rural settlements of the Republic of Sakha based on consumption frequency (dietary dependency) and income share (economic dependency) of wild foods. The figure provides the A) overall dietary dependencies of the average household by settlement (i.e. over all foods consumed and income sources); B) income-share dependence partition (pie charts) of the average household for two settlements representative of the Arctic (Kharyalakh) and non-Arctic (Rassoloda) regions, with indication of the corresponding distribution of the wild food share among food groups (silhouettes); and C) the average proportion by household of wild foods consumed for each food group (error bars corresponding to 1 SD). Note that in (B), proportions of plant-based (inc. vegetables, nuts, berries, and fruits) and fungi shares are grouped together. Total income refers to the household unit whether the adult-equivalent income is a per person measure where children and the elderly are assigned smaller weights so that the measure is directly comparable to the poverty line (see Materials and methods).
The spinning CD
Please share and like
Sharing and liking posts attracts new readers and boosts algorithm performance. I appreciate everything you do to support Briefed by Data.
Comments
Please let me know if you believe I expressed something incorrectly or misinterpreted the data. I'd rather know the truth and understand the world than be correct. I welcome comments and disagreement. We should all be forced to express our opinions and change our minds, but we should also know how to respectfully disagree and move on. Send me article ideas, feedback, or other thoughts at briefedbydata@substack.com.
Bio
I am a tenured mathematics professor at Ithaca College (PhD Math: Stochastic Processes, MS Applied Statistics, MS Math, BS Math, BS Exercise Science), and I consider myself an accidental academic (opinions are my own). I'm a gardener, drummer, rower, runner, inline skater, 46er, and R user. I’ve written the textbooks “R for College Mathematics and Statistics” and “Applied Calculus with R.” I welcome any collaborations. I welcome any collaborations.
The opening paragraph about type I and II errors in the issue of prisons for trans women is very interesting. I had never thought about it that way.
The most obvious answer to me seems to be separate accomodation for them but I know that just brings a whole lot of other issues and questions about infrastructure, cost-benefit analyses, etc!
On transgender women: look at the genitalia. If they still have male genitalia, house them in male prisons. Make this rule widely known. Otherwise, let female prisoners in their target women's prison make an informed vote whether to accept them.
(You may be able to tell that I believe a plurality or majority of male-to-female "gender-transformed" convicted offenders are either autogynephiles, or sexual predators, taking advantage of a naively constructed system. Those who go all the way may be exceptions.)
Edit: yes, that graphic is very well done. Conveys more information more clearly in much less space than text or tables would have taken.