


QTRS Jan 2, 2025
Graphs and interesting content for the curious

If you enjoyed this content, please press the like button above and share it. This really helps spread the word about Briefed by Data. Of course, if you are not already a subscriber, please consider becoming one.
NOTE: Knowing how much everyone likes surveys, I’ll be posting one next Tuesday. Please take a moment and complete it. The last time I did one was over a year ago, and it was helpful to me as it shaped what I post on Breifed by Data. Thank you in advance. Cheers, Tom
As I see it…
I tend to focus on problems and lean more pessimistic than optimistic, so it is nice to run into an article that I consider a win. This paragraph from How Jonathan Haidt Won the Fight Against Smartphones in School (12/30/2024) is a sign of hope:
This past fall, the Seaside School District became one of the first in Oregon to ban cell phones for both middle and high schoolers, forcing kids to lock their devices in pouches near the school entrance until the end of the day. Seaside has joined thousands of schools nationwide in recently banning smartphones, as a growing body of evidence shows they’re linked to falling test scores and rising rates of teen mental illness. This January, just over two million students will return to phone-free schools as statewide bans go into effect in Virginia and South Carolina. The following month, the Los Angeles Unified School District, the second-largest in the nation, will join them.
As I see it, anyone teaching knows how devestating smart phones have been for the classroom. It’s noticeable before class even starts as students sit quietly, staring at their phones instead of talking to each other. During class, many students can’t not pick up their phone to check it, while others will get lost in their phones for easily 5 minutes. Fighting this as a teacher is a lost cause. Of course, as soon as class is over, they are back on their phones. I’d be happier if they talked to each other about how bad class was.
“They looked at me like I was just going ‘wah, wah, wah,’ ” Kruger said, adding that most kids in her class were either asleep with their heads on their desks, wearing headphones, or doing a “dead-eyed scroll” through TikTok. And when she asked them to turn over their device, she said most students just “refused.”
“I’m 55, and I was like, ‘I don’t know if I can do another 10 years of this.’ ”
The last line of this quote is particularly important. Lost in the phone’s impact on students is the impact on teachers. Few recognize the power students have on the classroom environment. Teachers will tell you that classes have differing personalities, and some are more fun to work with than others. A disengaged class is not fun for the teacher, and it isn’t always on the teacher. It is hard to compete with the phone and the apathy it fosters. Good teachers are hard to come by; the cell phone has made the job worse, and good teachers may choose other careers. Agree? Disaree? Let me hear your stories in the comments.
The monoculture of higher education
It probably wouldn’t surprise anyone that if you have wealthier parents, you are more likely to become a doctor, lawyer, or academic. What might surprise you is how skewed this is, and higher education is worse than doctors and lawyers.
The graph here comes from the paper Climbing the Ivory Tower: How Socio-Economic Background Shapes Academia (Dec 2024). Note NBER papers are behind a paywall, but you get a few free per year.
About 50% of acedmics come from the top 20% of SES households, which is more than that for lawyers and doctors. Only about 25% come from the bottom 60% (apparently I’m a minority). This is your “inclusive” place called higher education. This is rather obvious to some of us, but it is nice to see it quantified, and no, I don’t think this is good for higher education or society.

There are numerous graphs in the paper. Here is one more so you can see the differences by discipline. There are also differences by college. Not surprisingly, Harvard is the most skewed.

Graph of the week
The Canadian 24-Hour Movement Guidelines for Children and Youth were the first to provide evidence-based recommendations for an optimal combination of movement behaviors for adolescents to accrue within the 24-hour day.2 Since then, similar guidelines have seen wide adoption.3 These guidelines recommend adolescents accumulate ≥60 minutes of moderate-to-vigorous PA,4 ≤2 hours of daily discretionary ST,5 and 8–10 hours of SL each day.
Note: ST = screen time, PA = physical activity. How do U.S. teens do (2022 data)? According to the paper Out-of-school Activities and Adherence to 24-hour Movement Guidelines (Jan 2025), not great. Only 4.8% of teens meet all three criteria (center of the venn diagram in A). In three cases, males did better than females, but those three all seem to be because males get more physical activity than females.

The four-day work week?
The article From Robots to Four-Day Weeks: The New Era of Work (12/31/2024) has seven graphs related to work, and the seventh one is copied here. The article includes these two quotes to justify the move to a four-day work week.
Iceland, Japan, and the Netherlands are at the forefront. Iceland’s trial program showed that 86% of workers maintained or improved productivity with fewer hours.
A compelling example? Microsoft Japan’s trial of a four-day workweek resulted in a 40% productivity boost.
I think there is a big mistake in these early studies, and that is assuming that these initial results will stand the test of time. I would argue that workers would be motivated at first to demonstrate that they’ll get at least as much work done in four days because they want a four-day work week. Over time, I’d bet on productivity dropping to what anyone typically gets done in four of their five days now.

In fact, I think this is the same problem with a lot of educational studies. Someone tries out a new mode of teaching (say, flipped learning), and at first students are more engaged because it is different. Hence they do a little better. The new technique is declared as something that everyone should. Over time students get used to the new technique and lose interest, ending up back to where they were in learning, or worse, as the new technique may not actually be better, just novel at the time.
Two graphs from the eia
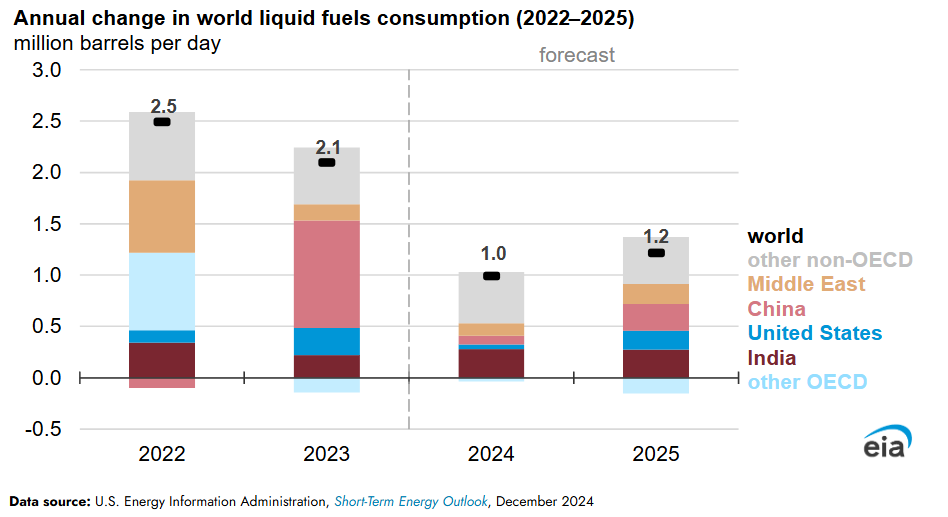
The first come from India to surpass China as the top source of global oil consumption growth in 2024 and 2025 (12/19/2024). My interest here is less with India and more with what the graph says. First, it is easy to confuse a graph about change with totals. From 2022 to 2024, we did not use less liquid fuels; it is only that the growth of liquid fuels slowed down. For example, in 2024 we used 1 million more barrels per day than in 2023. The projection for 2025 is that liquid fuel consumption will grow. Just another example that we will use all available energy.
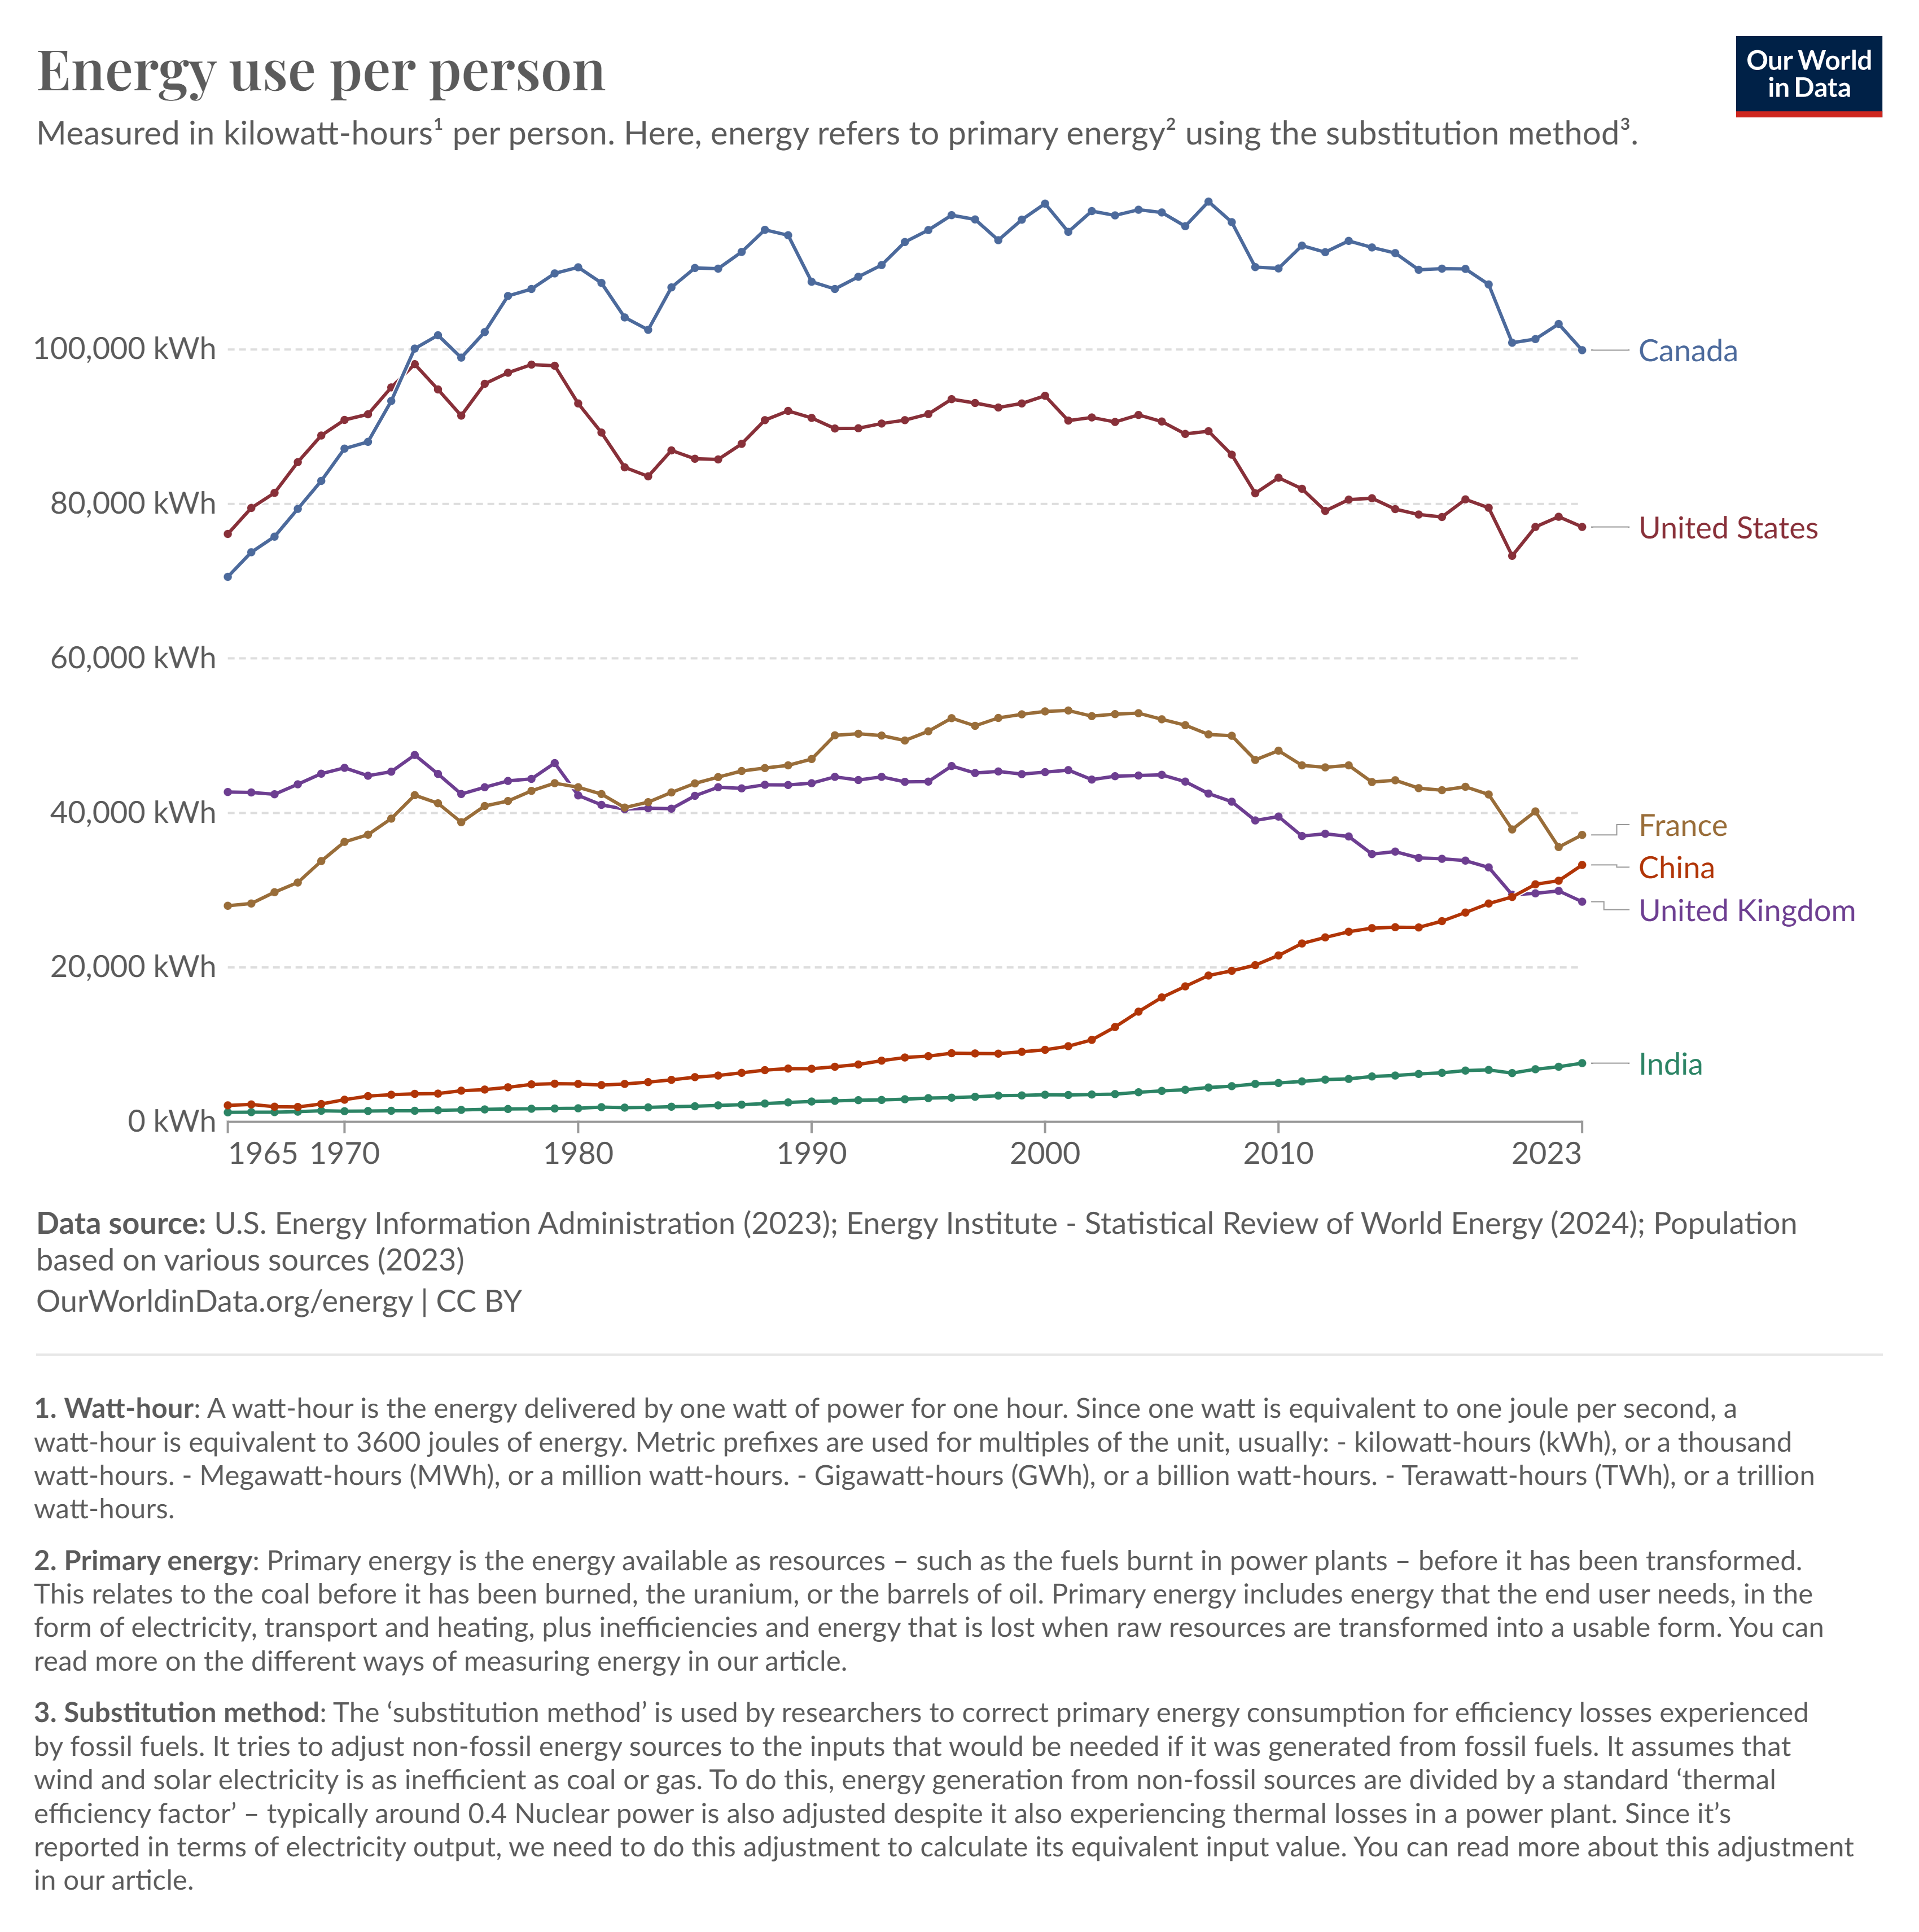
As to India, who can blame them? India’s energy use per capita in 2023 is about 10% of that in the U.S. This is a fundamental conflict when it comes to climate change. There are a lot of countries that want to live like wealthier countries, and to do that, they need more energy. If, say, the U.S. were to use fewer fossil fuels, then poorer countries are more than happy to use them.
As for the U.S., here is the second eia graph of the day from Improved efficiency is enabling record U.S. crude oil production from fewer rigs (12/23/2024). The lower 48 crude oil production has been increasing, and we are getting more efficient at production with fewer rigs.

Who says they are thriving?
If you asked Blacks, Hispanics, and Whites if they consider that they are thriving, who wins? According to the Black Thriving in America 2024 report, 52% of Black Americans say they are thriving, which is more than White Americans (50%) and Hispanic Americans (48%).
What might be more interesting is the Black response over time. In the graph, you’ll see much more variability in their response. I have to wonder how much media influences this.

The spinning CD
Please share and like
Sharing and liking posts attracts new readers and boosts algorithm performance. I appreciate everything you do to support Briefed by Data.
Comments
Please let me know if you believe I expressed something incorrectly or misinterpreted the data. I'd rather know the truth and understand the world than be correct. I welcome comments and disagreement. We should all be forced to express our opinions and change our minds, but we should also know how to respectfully disagree and move on. Send me article ideas, feedback, or other thoughts at briefedbydata@substack.com.
Bio
I am a tenured mathematics professor at Ithaca College (PhD Math: Stochastic Processes, MS Applied Statistics, MS Math, BS Math, BS Exercise Science), and I consider myself an accidental academic (opinions are my own). I'm a gardener, drummer, rower, runner, inline skater, 46er, and R user. I’ve written the textbooks “R for College Mathematics and Statistics” and “Applied Calculus with R.” I welcome any collaborations. I welcome any collaborations.
Professor-
Way too much interesting stuff packed into one posting!
Most of these charts could stand on their own and generate some interesting dialogue:
e.g.
Has the reduction or elimination of performance standards in our public school systems increased or reduced the equality gap?
Happy new year.