


QTRS May 15, 2025
Graphs, commentary, and interesting content for the curious

As I see it…
As a data professional, one of my frustrations is that narratives often take precedence over facts. There are reasons for this; in particular, narratives are easier to understand and repeat, whereas data tends to be more complex and harder to discuss. The problem with narratives is they are often wrong.
The eia has a graph forecasting residential electricity prices rising faster than inflation for the next two years, and I’m predicting it’s going to fuel a narrative.
Retail electricity prices have increased faster than the rate of inflation since 2022, and we expect them to continue increasing through 2026, based on forecasts in our Short-Term Energy Outlook. Parts of the country with relatively high electricity prices may experience greater price increases than those with relatively low electricity prices.

As I see it, we are going to hear a lot about how solar and wind are driving up residential electricity prices. Is this true? However, the situation is probably more complex than it appears. In my post, Does more renewable electricity reduce prices? (8/20/2024) I noted that, at least for May 2024, a higher percentage of renewals is not related to lower costs and that a better predictor for lower costs was the state’s political leaning. This data tells me that it isn’t a simple relationship between renewables and electricity cost.
One of the reasons the eia provides for the increased costs in electricity is “increased capital investment to replace or upgrade aging generation and delivery infrastructure.” Even if solar and wind are less expensive, they do require upgrades to the grid. In general, the whole run-the-world-on-electricity idea requires major upgrades to our grid, which will increase electricity prices. Fairly or unfairly, I expect the narrative that takes hold to be that solar and wind are increasing your electricity bill. This is a simple narrative that about half the country is inclined to believe immediately, but the situation is much more complex than that. As a rule, I believe that things are never as good as supporters claim and never as bad as detractors suggest. Either way, be highly skeptical of simple narratives. Regarding my prediction, we will find out if I am correct in the next year or two.
Let’s go to some data.
Student loan repayment delinquency
Expect to hear about the percentage of student loans in delinquency going up, but this is all due to the fact that these loans have to be repaid again. Payments were put on pause during Covid and only recently resumed.
This isn’t the real story, though. The graph below, sourced from the Federal Reserve Bank of New York's Q1 2025 report, shows a significant increase in student loan delinquencies (indicated by the red line) on the far right; however, the real story starts in 2012. Student loans had the highest delinquency rate starting in 2012 and went up when other loan delinquencies were going down. In an economy that was doing well, lending for student loans was the worst bet.
I see this as a problem for higher education’s return on investment narrative. If a student can’t pay back a loan, then the return on investment wasn’t there. My cynical take here is that the push for student loan forgiveness, supported by the left, which is almost all of higher education, is to help hide that the return on investment in higher education isn’t there for many students. Moreover, due to grade inflation and lower academic standards—caused by various factors, including the desire to retain students—the value of a degree has diminished because many students have not acquired the skills and knowledge they are expected to gain. My concern is that faculty and administrators have convinced themselves that acquiring the degree is what matters and not what it is supposed to represent. We’ll see, but I’m betting student loan delinquencies continue to rise.

Graph of the week
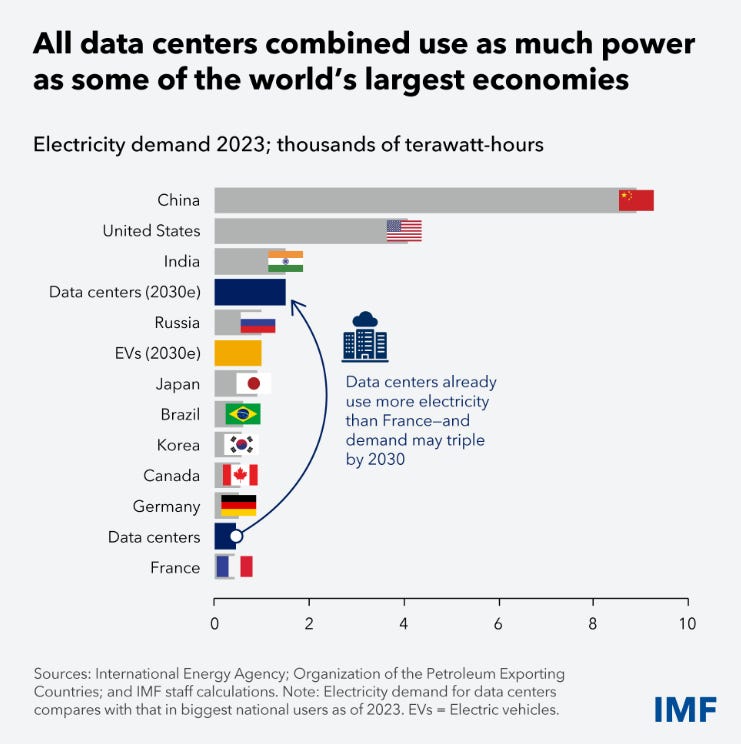
This IMF graph really puts the electricity demand of data centers and EVs into perspective. Worldwide electricity from data centers already consumes more than all but 11 countries and could become a top-four user by 2030. Meanwhile, EVs are estimated to be sixth on the list as a country, although I’m less convinced this will happen. Either way, this is a lot of electricity that needs to be generated and grids that need to be upgraded. In other words, upward pressure on electricity prices.
More on electricity, U.S. demand
One more graph from the eia.
Much of the recent and forecasted growth in electricity consumption is coming from the commercial sector, which includes data centers, and the industrial sector, which includes manufacturing establishments.

Remote work has it’s downside
This comes from the Gallup report The Remote Work Paradox: Higher Engagement, Lower Wellbeing (5/8/2025). Remote work sounds wonderful and is probably fine if you have an established friend group, but I do think there is an upside to interacting with people regularly, if not at work, then somewhere somehow. Humans are exceptional at choosing what they want rather than what they need.

Divorce is rough on kids
The abstract from the NEBR paper Divorce, Family Arrangements, and Children's Adult Outcomes (5/25/2025)
Nearly a third of American children experience parental divorce before adulthood. To understand its consequences, we use linked tax and Census records for over 5 million children to examine how divorce affects family arrangements and children's long-term outcomes. Following divorce, parents move apart, household income falls, parents work longer hours, families move more frequently, and households relocate to poorer neighborhoods with less economic opportunity. This bundle of changes in family circumstances suggests multiple channels through which divorce may affect children's development and outcomes. In the years following divorce, we observe sharp increases in teen births and child mortality. To examine long-run effects on children, we compare siblings with different lengths of exposure to the same divorce. We find that parental divorce reduces children's adult earnings and college residence while increasing incarceration, mortality, and teen births. Changes in household income, neighborhood quality, and parent proximity account for 25 to 60 percent of these divorce effects.
The spinning CD
Please share and like
Sharing and liking posts attract new readers and enhance algorithm performance. I appreciate everything you do to support Briefed by Data.
Comments
Please let me know if you believe I expressed something incorrectly or misinterpreted the data. I'd rather know the truth and understand the world than be correct. I welcome comments and disagreement. Please feel free to share article ideas, feedback, or any other thoughts at briefedbydata@substack.com.
Bio
I am a tenured mathematics professor at Ithaca College (PhD in Math: Stochastic Processes, MS in Applied Statistics, MS in Math, BS in Math, BS in Exercise Science), and I consider myself an accidental academic (opinions are my own). I'm a gardener, drummer, rower, runner, inline skater, 46er, and R user. I’ve written the textbooks “R for College Mathematics and Statistics” and “Applied Calculus with R.” I welcome any collaborations. I welcome any collaborations.