

QTRS Template
Graphs, commentary, and interesting content for the curious

As I see it . . .
A post on X stated that single females spent more time doing household chores than single males based on the time use survey. The post implied that women have higher standards, which is why they do more housework than men. If I can get this data, I’ll do a post on it, but for now I’m not concerned whether it is true or not as it does make a key point.
As I see it, there is enough data available and enough people who can work superficially with data to cause more harm than good. Worse, there are academic disciplines whose main charge is to raise attention to women’s issues and not dig deeper into data to try and undertand why.
It is well known that women do more housework than men, and the takeaway is that this is unfair and due to males doing less than their share. We have an activist class of academics that also influences students who go on to become, say, journalists, who have no incentives to explore why. They go with the easy answer that fits their activist narrative; they are not analysts.
In terms of the “who does more housework” issue, I wrote about this topic almost three years ago in How should contributions to household chores be measured? (9/19/2023) Time is only one measure; risk of activity, energy required, value, and satisfaction are others.
I bring up the X post because it illustrates the data rule: Always consider other factors, as single-factor explanations are rare. I should add a corollary to this rule in that just because you can’t think of other factors doesn’t mean they don’t exist. I’ve written about this issue but hadn’t thought about exploring what men and women do when living alone.
Related to the activist class favoring women is the issue of girls not doing as well as boys in math. This is true, but why is a complex question. Yet, what few people seem to know is that girls do better at reading than boys; in fact, their advantage at reading is greater than the boys’ advantage at math. If your goal is to fix inequalities, then the reading inequality is a bigger problem than the math inequality. You’ll find this data in my post, Is School Failing Boys? (2/10/2026)
The point here is that simple narratives pushed by activists should be taken with a grain of salt at best; you should ask deeper questions. Further, activists often do more harm than good by pushing one side instead of maintaining balance. Boys have been behind in reading for years with little effort to address it, while women are now almost 60% of college students. Could we have a deeper understanding of fair household duties today if we tried to understand why differences existed, resulting in better relationships?
On a positive note, at least when it comes to female activism, we now have organizations such as the American Institute for Men and Boys (AIMB). They don’t have the time and influence that tenured faculty have, but it is a good start.
What other activism or narratives need balance? Leave your thoughts in the comments.
Let’s go to some data.
On boys
Since I highlighted AIMB above, here is their list of key stats from their report: Educating boys: Bridging gaps, building futures (ANNALS Volume 716) (5/21/2026). Two points here. First, putting effort into boys isn’t a zero-sum game that will take away from efforts for girls; at least it shouldn’t be. Second, the value of having departments of women’s studies in some version provides amplification for issues. Consider how much attention this data would receive in college classes if the data were flipped between boys and girls.
The GPA gap: There are now two girls for every one boy in the top 10% of high school students ranked by GPA.
The degree reversal: In 1970, men earned 57% of bachelor’s degrees; today, that has flipped, with women earning 58% of bachelor’s degrees and men earning only 42%.
Early predictors: Performance on 3rd-grade tests is a powerful predictor of future college success, yet for many achievement levels, boys must outperform girls by two deciles in the 3rd grade to have similar odds of four-year college enrollment.
Special education services: Boys make up approximately 65% of all students receiving special education services under the Individuals with Disabilities Education Act (IDEA), while girls make up only 35%.
Working later in life
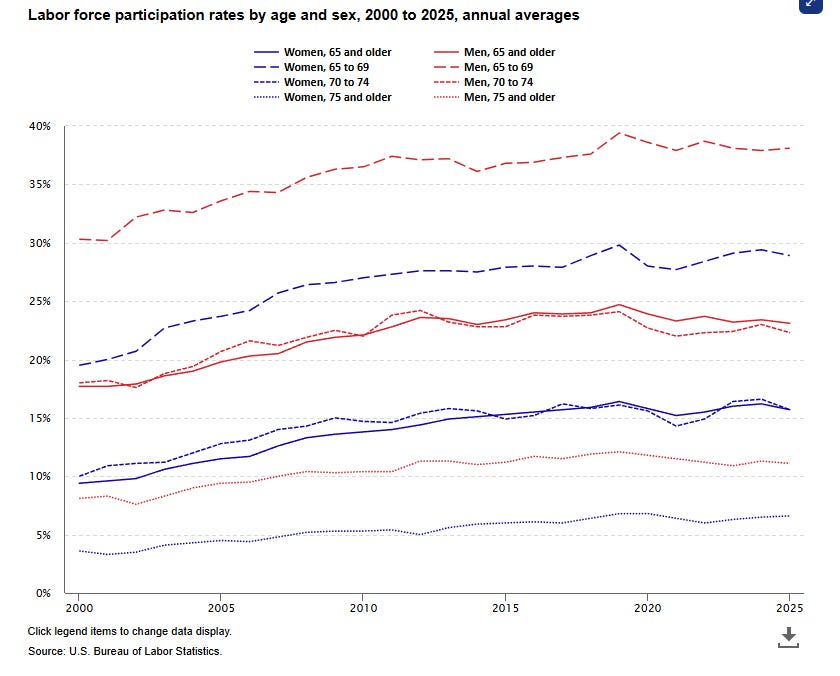
This is an interesting chart from the BLS. Generally older people are working more. The real question is whether they work out of necessity or desire. Also notice that older men work at higher rates than older women at all age groups. As I’ve noted today, if this were reversed, we’d hear about it, but again, why is an important question to get answered.
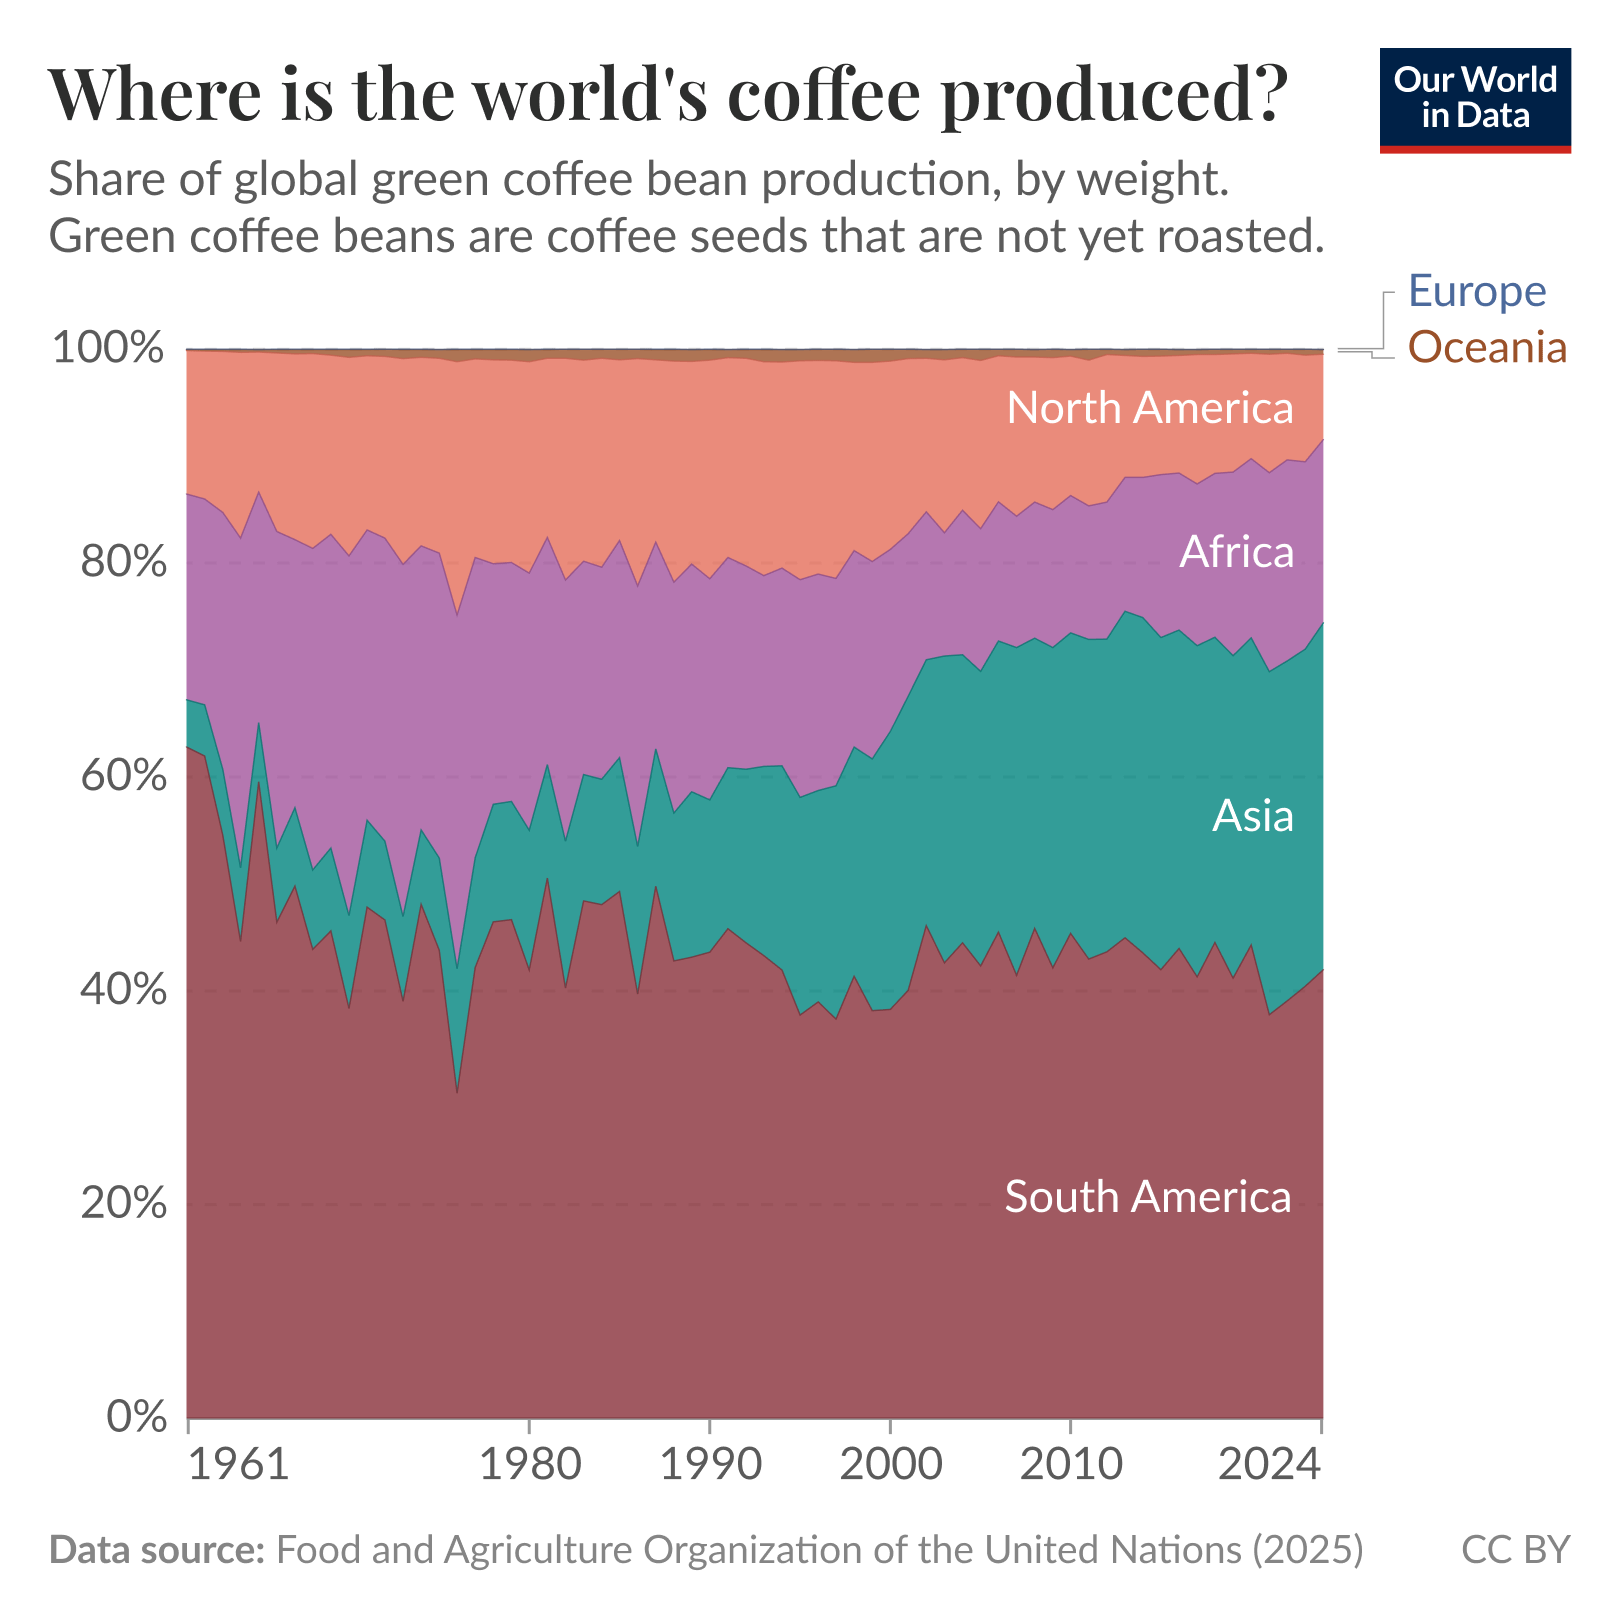
Where does your coffee come from?
I don’t have anything to say here. Sometimes I simply think a graph is worth knowing. From Our World in Data (5/26/2026)
EIA graph of the week
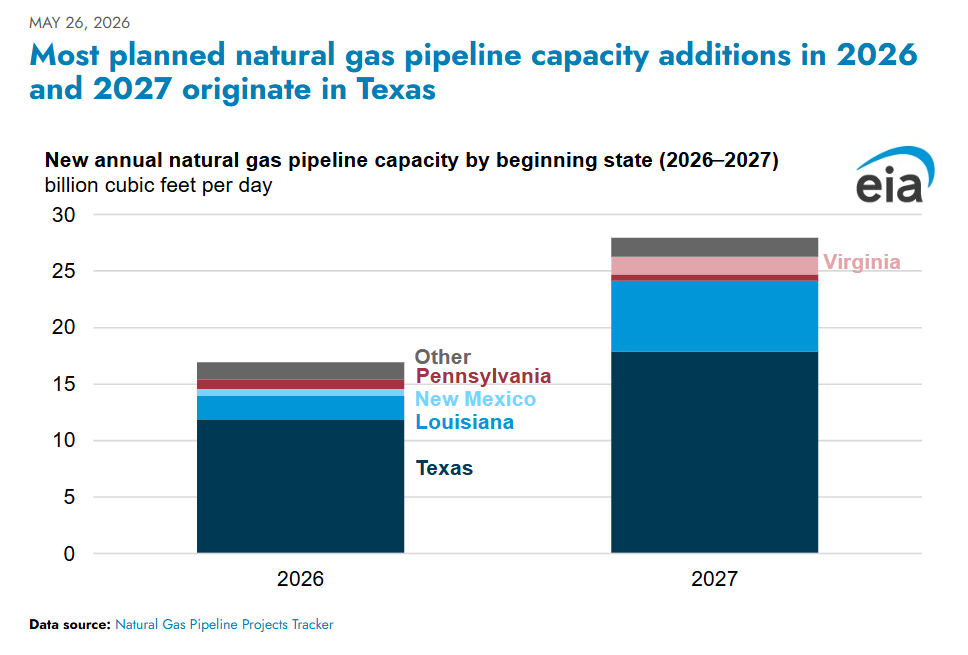
We aren’t adding natural gas pipelines to not burn natural gas. Here is where they are expanding or were the starting point of new pipelines are.
Developers plan to bring approximately 44.9 billion cubic feet per day (Bcf/d) of new pipeline capacity online in the United States in 2026 and 2027, according to our latest Natural Gas Pipeline Projects Tracker. Approximately 70% (31.6 Bcf/d) of this new capacity is already under construction. More than 66% (29.7 Bcf/d) of the capacity additions originate in Texas. Louisiana is second with 19% (8.4 Bcf/d) of total capacity additions.
The projects in Texas will provide additional takeaway capacity out of the Permian Basin and debottleneck the Waha Hub, supplying natural gas to LNG export terminals, as well as residential, power, and industrial users.
The spinning CD
Love this band. Their covers are fantastic.
Please share and like
Sharing and liking posts attracts new readers and boosts algorithm performance. I appreciate everything you do to support Briefed by Data.
Comments
Please let me know if you think I expressed something incorrectly or misinterpreted the data. I would rather know the truth and understand the world than simply be correct. I welcome comments and disagreement. I encourage you to share article ideas, feedback, or any other thoughts at briefedbydata@substack.com.
Bio
I am a tenured mathematics professor at Ithaca College, holding a PhD in math (stochastic processes), an MS in applied statistics, an MS in math, a BS in math, and a BS in exercise science. I consider myself an accidental academic (opinions are my own). I am a gardener, drummer, rower, runner, inline skater, 46er, and R user. I’ve written the textbooks “R for College Mathematics and Statistics” and “Applied Calculus with R.” I welcome any collaborations, and I’m open to job offers (a full vita is available on my faculty page).
Perhaps too much housework is being done?
If we simply asked women to leave those dirty socks under the corner of the bed and to only wash the underwear that smell bad we could even things out and achieve housework equality.
This worked in my freshman dorm and nobody died.