Quick takes and random stuff, Dec 28, 2023
Amazon map, November temps, tears, UV-R, and more
I hope everyone is enjoying the holidays. I took Tuesday off, and I won’t post on next Tuesday either. But I’ll keep up with quick takes and expect a statistics animation on Saturday. Enjyo, and don’t forget to share.
Graph of the week
This map of the Amazon biomass comes from the paper A biomass map of the Brazilian Amazon from multisource remote sensing (9/30/2023). To me, this is a cool map created with cool science.

Here is the stated purpose of the paper and map:
We present a new biomass map for the Brazilian Amazon as a reference for the scientific community and government. The map was produced using the largest Light Detection and Ranging (LiDAR) database collected from aircraft flying over the Brazilian Amazon region. This map can be used to support further work and discussions about carbon fluxes in the tropical forest of the Amazon, project future atmospheric CO2 concentrations, and determine mitigation policies. Possible applications include contributing to UNFCCC reports, the Intergovernmental Panel on Climate Change (IPCC), and incentivizing reductions in greenhouse gas emissions from deforestation and forest degradation (REDD+). Additionally, the map and the original dataset can support and help models estimate carbon losses and gains due to human activities and climate change.
How hot was November 2023?
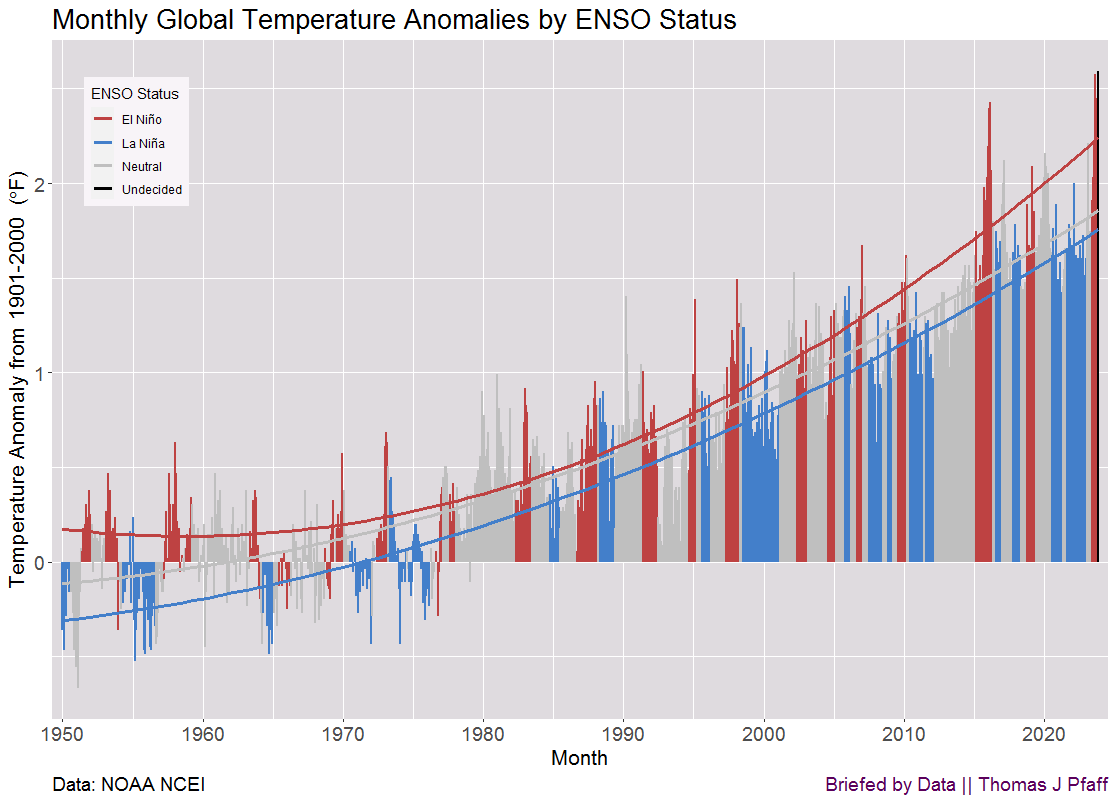
As expected, 2023 set a record for November temperature, as can be seen in the graph.
The last bar in black will be classified as El Niño, and while the record looks extreme, it is largely following the pattern of the red bars. From the NOAA report for November 2023, which includes links to the data:
The November global surface temperature was 1.44°C (2.59°F) above the 20th-century average of 12.9°C (55.2°F), making it the warmest November on record. This was 0.38°C (0.68°F) above the previous record from November 2015. November 2023 marked the 47th-consecutive November and the 537th-consecutive month with temperatures at least nominally above the 20th-century average.
November saw a record-high monthly global ocean surface temperature for the eighth consecutive month. El Niño conditions that emerged in June continued into November, and according to NOAA's Climate Prediction Center there is a 60% chance that El Niño will continue through April–June 2024.
Here is the graph for all months for context. Again, note that the last few months are in line with the anomalies during El Niño. I’ll have more to say about this in a future post.
UV-R and state capacity
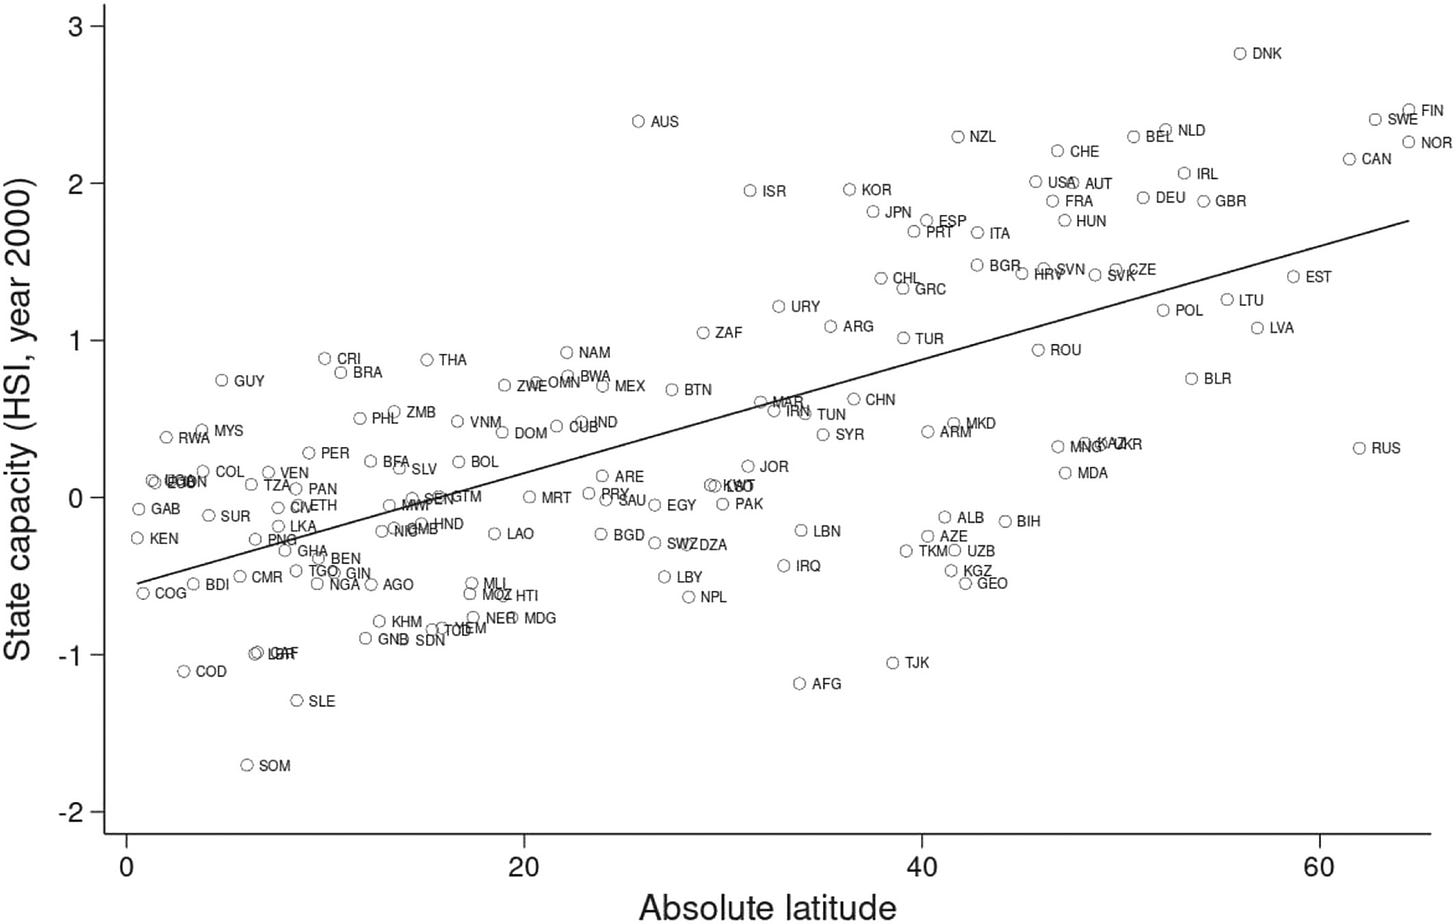
The article Sunlight, culture and state capacity (12/15/2023) has this graph and this to say in the abstract.
This paper examines the impact of ultraviolet radiation (UV-R) on state capacity. The results indicate that the intensity of UV-R is a strong predictor of cross-country differences in state capacity. Countries with a higher degree of UV-R exposure tend on average to have weaker states. This finding remains unaffected after controlling for different variables that may be correlated with both UV-R and state capacity, including an extensive set of geographical, historical and contemporary factors.
The graph is interesting as there is a clear relationship between latitude and state capacity, defined broadly as “the ability of a state to attain its intended policy goals.” What is the connection between UV-R and state capacity? They note that individualistic societies are more democratic as compared to more kin-based societies, which often end up being more authoritarian. I talk about some of this in my post W.E.I.R.D. and the new kinship. The relationship starts with the fact that UV-R increases cataracts. Fair enough so far. Now the connection:
The first one has to do with the idea that a higher risk of eye disease generates uncertainty and a preference for risk aversion, increasing the relevance of kinship networks as an insurance mechanism against the negative consequences of visual impairment and leading ultimately to the emergence of collectivist values.
and
Furthermore, Fredriksson and Mohanty (2021) identify an additional pathway linking cataracts and the individualism–collectivism cleavage. As pointed out by these authors, although cataracts are not contagious, they may be perceived by others as a sign of potential health threat, either consciously or unconsciously (Nussinson et al., 2018; Wu & Chang, 2012). According to the parasite-stress theory developed by Fincher et al. (2008) and Thornhill et al. (2009), this suggests that communities located in regions with higher cataract prevalence may tend to adopt collectivist values as a defence mechanism with an in-group conservative bias against foreigners and outside influence, putting stronger limits on individual behaviour.
The paper and argument are interesting. I’m having a hard time fully accepting the argument, but it is clear that there is a relationship between latitude and state capacity that is worth trying to explain.
Crime and wealth
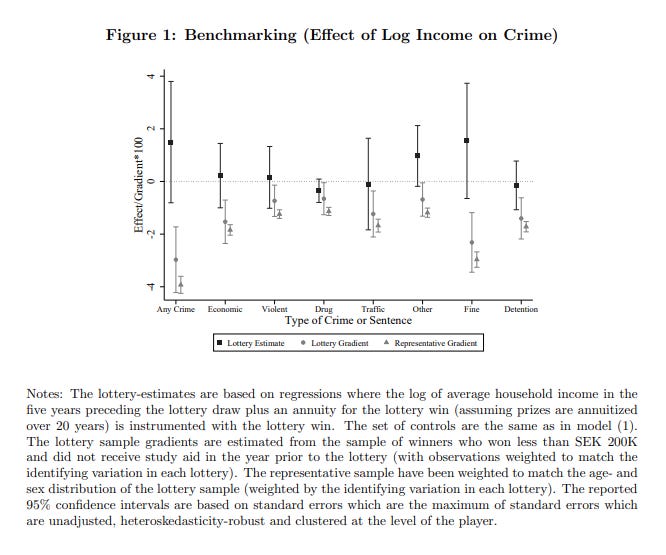
Alex Tabarrok from Marginal Revolutions summarizes this graph and results from the DOES WEALTH INHIBIT CRIMINAL BEHAVIOR? EVIDENCE FROM SWEDISH LOTTERY WINNERS AND THEIR CHILDREN (December 2023)
In their most important result, shown below, Cesarini et al. convert lottery wins to equivalent permanent income shocks (using a 2% interest rate over 20 years) to causally estimate the effect of permanent income shocks on crime (solid squares below) and they compare with the cross-sectional results for lottery players in their sample (circle) or similar people in Sweden (triangle). The cross-sectional results are all negative and different from zero. The causal lottery results are mostly positive, but none reject zero. In other words, randomly increasing people’s income does not reduce their crime rate. Thus, the negative correlation between income and crime must be due to a third variable. As the authors summarize rather modestly:
Although our results should not be casually extrapolated to other countries or segments of the population, Sweden is not distinguished by particularly low crime rates relative to comparable countries, and the crime rate in our sample of lottery players is only slightly lower than in the Swedish population at large. Additionally, there is a strong, negative cross-sectional relationship between crime and income, both in our sample of Swedish lottery players and in our representative sample. Our results therefore challenge the view that the relationship between crime and economic status reflects a causal effect of financial resources on adult offending.
Assuming this result holds for the U.S., and it may or may not, it has a lot of policy implications. In particular, you can’t reduce crime by giving people money. The Marginal Revolutions post discusses possible objections to the paper and is a good short read.
Adapting to climate change
From After a Decade of Planning, New York City Is Raising Its Shoreline (12/19/2023):
When that is completed, the park will be landscaped with pathways and vegetation beds that snake around and through sports fields, an amphitheater, and playgrounds to form a terraced topography that will function as a berm to keep water from city streets. More floodwalls and retractable gates will run the park’s length and extend into surrounding streets, where archaic infrastructure will be overhauled so stormwater is less likely to mix with wastewater during flooding.
In other New York City boroughs, even more progress has been made. On Staten Island, another winner of the Rebuild by Design competition, Living Breakwaters, is on track for completion next year. The project involves a network of breakwaters off the southern tip of Staten Island that will dampen destructive wave action and provide habitat for oysters and other marine life. On Staten Island’s shore, the state has bought out and removed homes to make way for periodic flooding. At Rockaway Beach, in Queens, a steel-reinforced concrete boardwalk has replaced the wooden one that was lost during Sandy; running underneath it, a concrete retaining wall helps keep sand and a new dune system from washing away during large storm surges.
Smart move by NYC, and there are others:
Norfolk, along with New York and 24 other U.S. cities, is a member of the Resilient Cities Network, a global collective of 100 cities that were identified, in 2013, as already having advanced resilience strategies that take into account the physical, social, and economic challenges of climate change. Under the 100 Resilient Cities program, funding was made available for cities to appoint chief resilience officers who then worked together to develop a holistic, global resiliency strategy based on community dialogue, protecting vulnerable residents first, and incorporating nature-based infrastructure. At COP28 this month, there was even an emphasis on “nature-positive cities” — an indication, says Henk Ovink, that when it comes to the concept of living with water, the knowledge gap between governments, businesses, and local communities is gradually narrowing. “Adaptation is still lagging behind massively, and so is mitigation,” Ovink says. “But there is a tilt happening, because no one escapes climate change impacts and, at the same time, preparedness pays.”
I don’t think the media talked much about the adaptation strategies discussed at COP28. I tend to think that the media doesn’t want to talk about adaptations because there focus is on stopping climate change. If you discuss adaptations, then it could convince people that cutting CO2 isn’t that important. I would say this is negligence on the part of the media, as we have to adapt because warming is happening and will continue.
Tears work
From the paper A chemical signal in human female tears lowers aggression in males (12/21/2023):
Humans, however, don’t have an accessory olfactory system [43,44]. Instead, here, we find that perceptually odorless emotional tears activate 4 specific human main ORs in a dose-dependent manner. We also find that this signal reduces overall levels of activity in the aggression brain network and increases functional connectivity between the brain substrates of olfaction and aggression. Finally, we find that sniffing this signal is associated with a remarkable 43.7% reduction in aggressive behavior.

Data Rule: Normalize properly; ask, “Per what?”
The U.S. Bureau of Labor Statistics provides us with this map (it is also interactive if you click on the link) of gas stations per square mile in each county with this caption:
With 2.95 gas stations per square mile in the second quarter of 2023, Kings County, New York, had the highest density of establishments that are primarily gas stations (with or without a convenience store). In fact, four of the five New York City boroughs are in the top 10 counties with the highest gas station density. The other six counties are in Virginia (5 counties) and New Jersey (1 county). Higher density counties tend to be more concentrated on the east coast and density drops moving west across the U.S.
Is anyone surprised that New York is high on the list? This is a good example of the need to normalize properly. How about gas stations per capita? or maybe better gas stations per registered vehicle? What this map is largely showing us is where there are lots of people.
The spinning CD
Neoteric Ensemble - Arriba - by Mark Nightingale. Enjoy some brass.
Please share and like
Please help me find readers by forwarding this article to your friends (and even those who aren't your friends), sharing this post on social media, and clicking like. If you're on Twitter, you can find me at BriefedByData. If you have any article ideas, feedback, or other views, please email me at briefedbydata@substack.com.
Thank you
In a crowded media market, it's hard to get people to read your work. I have a long way to go, and I want to say thank you to everyone who has helped me find and attract subscribers.
Disagreeing and using comments
I'd rather know the truth and understand the world than always be right. I'm not writing to upset or antagonize anyone on purpose, though I guess that could happen. I welcome dissent and disagreement in the comments. We all should be forced to articulate our viewpoints and change our minds when we need to, but we should also know that we can respectfully disagree and move on. So, if you think something said is wrong or misrepresented, then please share your viewpoint in the comments.


