


Quick takes and random stuff February 1, 2024
Penguins, Phil, seaweed, sand, the Roman Empire, fertility and more

Graph of the week
In support of the men thinking about the Roman Empire meme, here is this week’s graph of the week from Climate change, society, and pandemic disease in Roman Italy between 200 BCE and 600 CE (1/26/2024), providing you with a complete climate reconstruction in one figure.
On the basis of existing literature, we assembled a comprehensive catalog of attested epidemic disease outbreaks in Italy across the eight centuries covered by our record (table S1). In our record, the three major pandemic events of Roman antiquity (11)—the Antonine Plague (onset ~165 CE), the Plague of Cyprian (onset ~251 CE), and Plague of Justinian (onset ~541 CE)—are strongly associated with pronounced climate change, although in varying ways. The Antonine Plague occurred during the cold pulse between ~160 and ~180 CE that followed several decades of trends toward cooling and aridity. The Plague of Cyprian coincides with a second phase of severe cooling, with even more arid conditions, after the brief warmer period between ~215 and ~245 CE. Last, the First Plague Pandemic originates at a moment of extreme cooling in the 530s to 540s, and recurrent outbreaks occur in the generally cooler sixth century, notably ~590 CE.
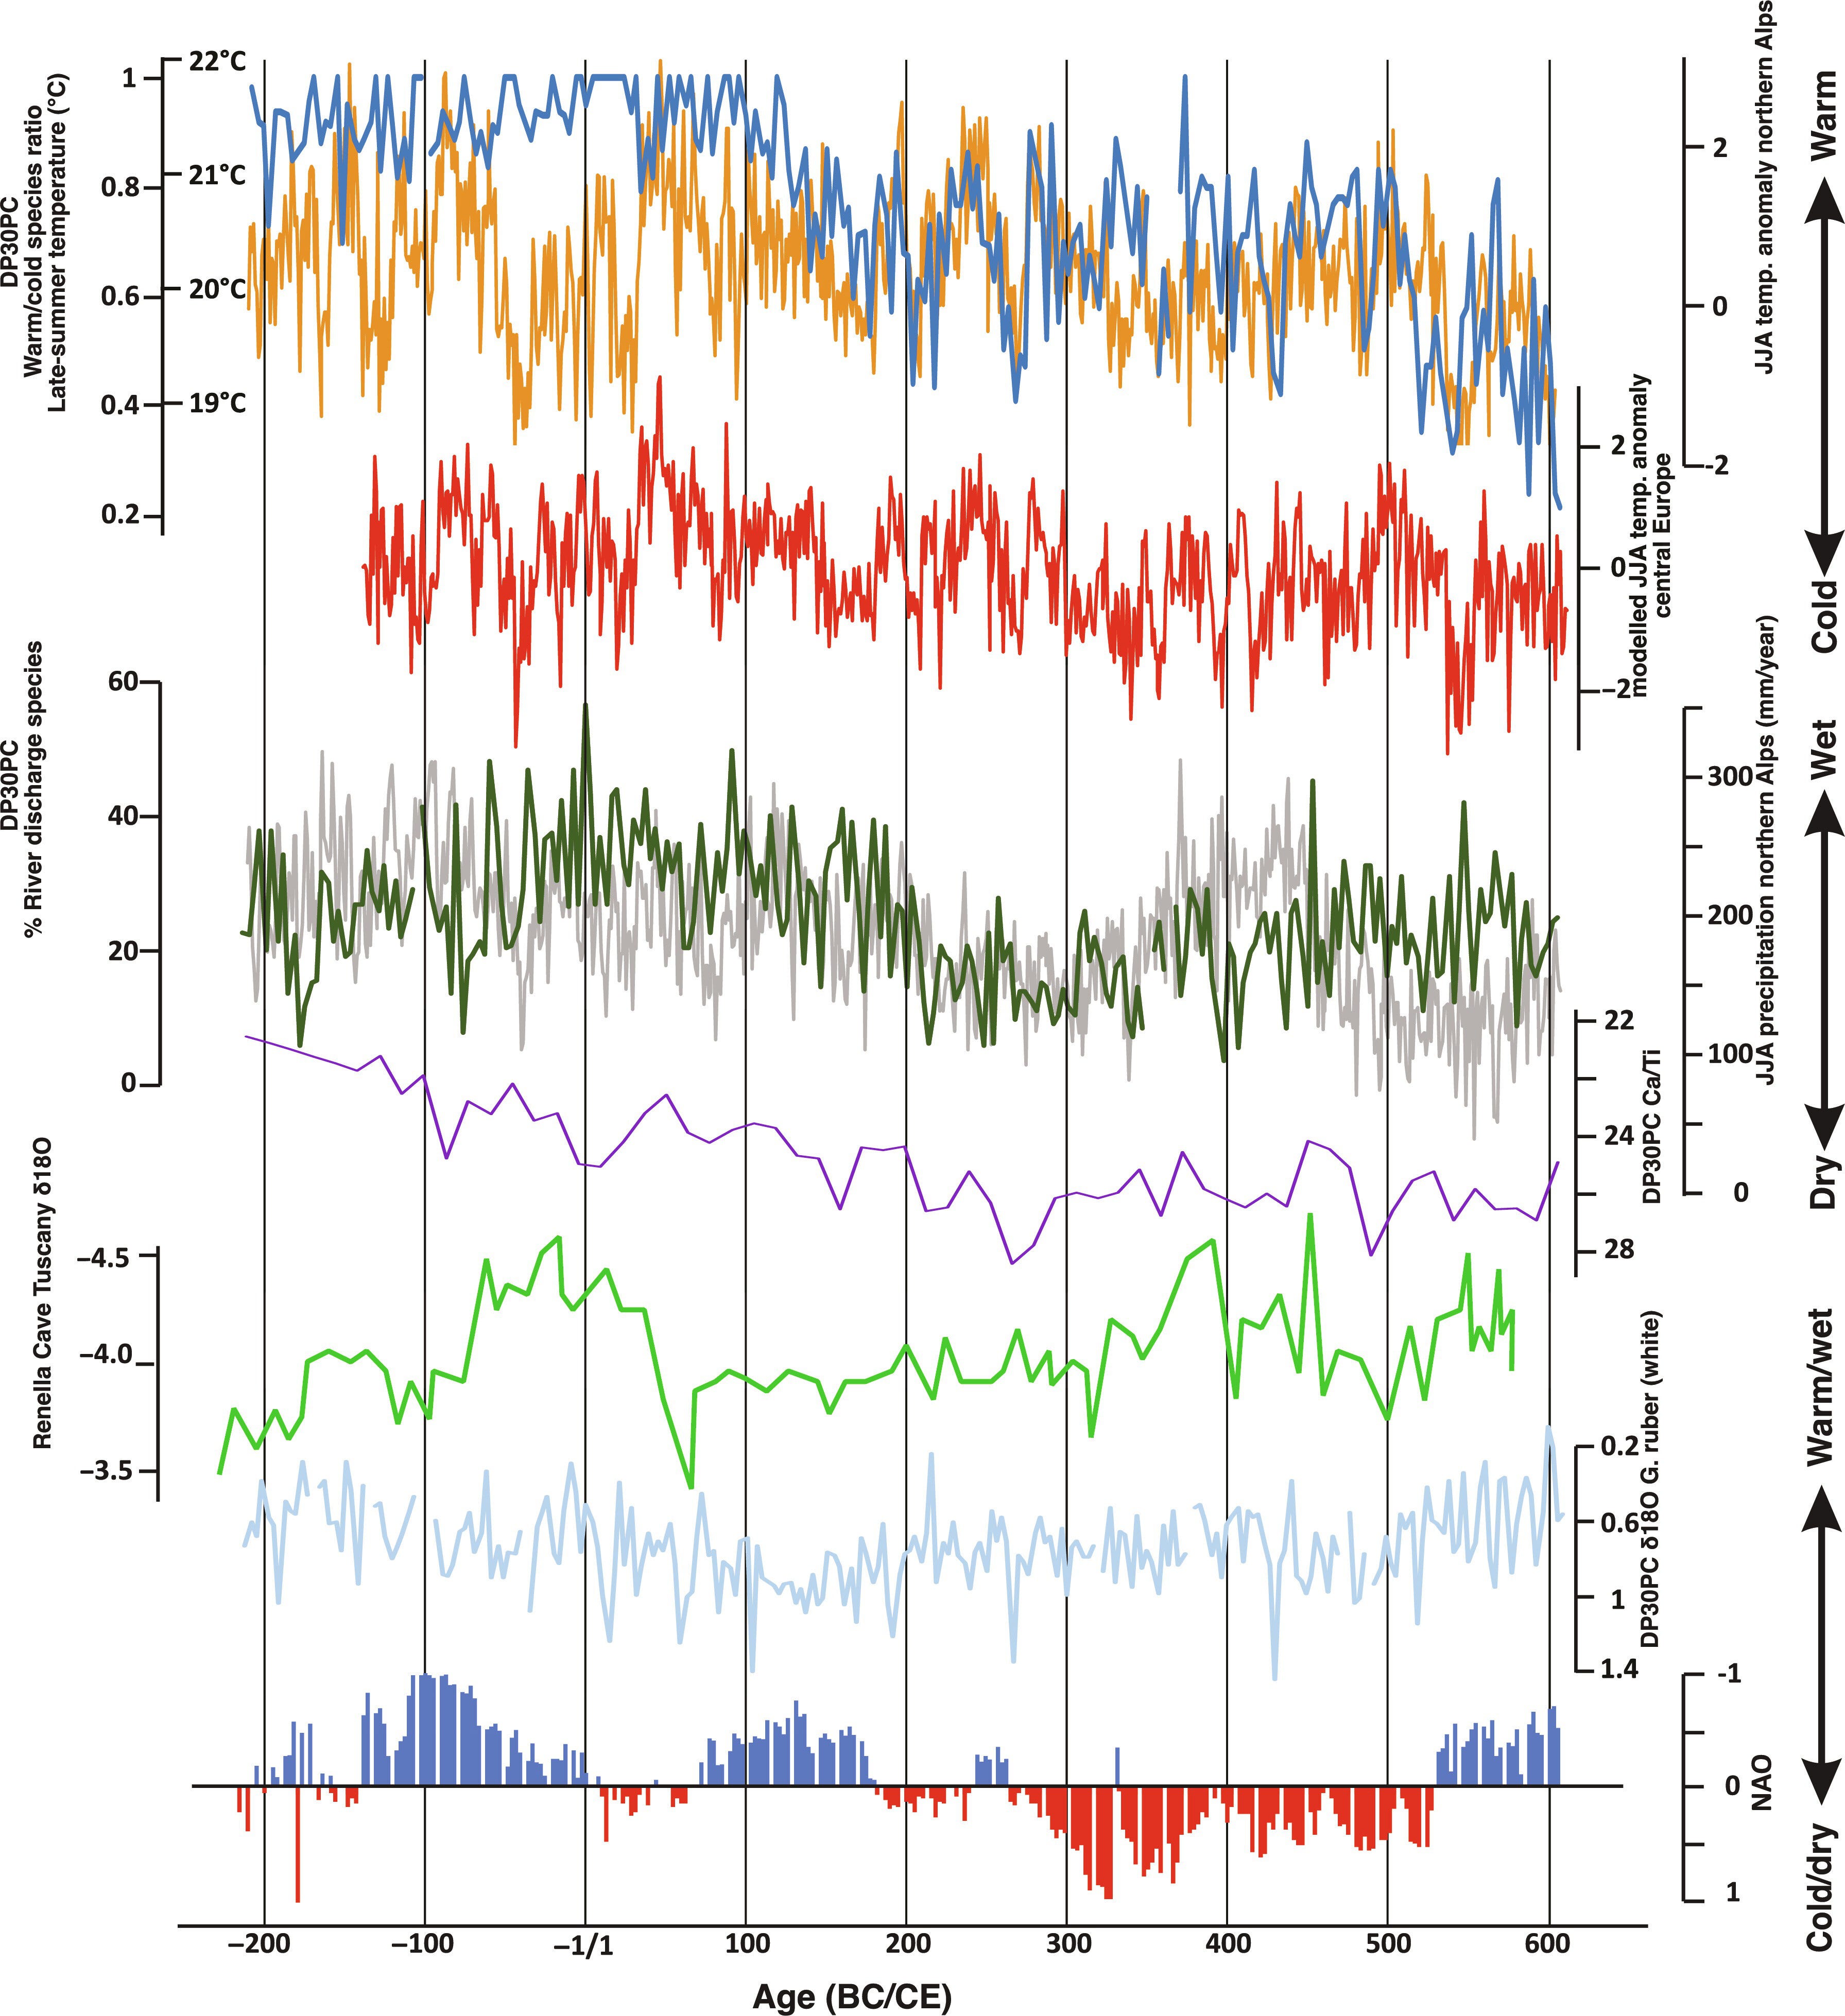
Here is the caption that goes with the graph.
Core DP30PC and paleoclimatic records. Dark blue: Gulf of Taranto, late-summer temperature reconstruction based on dinoflagellate cyst composition (this study); orange: Northern Alps, June to August dendrochronological-based temperature reconstruction (3); red: proxy-based central European, June to August (JJA) temperature reconstruction (33); dark green: Core DP30PC Gulf of Taranto, late-summer river discharge (precipitation) reconstruction based on dinoflagellate cyst composition (this study); gray: Northern Alps, June to August dendrochronological-based precipitation reconstruction (3); purple: Gulf of Taranto, Ca/Ti concentrations (73); green: δ18O [per mil (‰) Vienna Pee Dee belemnite (VPDB)] of stalagmite RL4, Renella Cave Tuscany, Central Italy (15); light blue: DP30PC δ18O (‰ VPDB) of the planktonic foraminifera Globigerinoides ruber (white) (76) and NOA Index (75).
I am a bit surprised that they didn’t mark the plague periods on the graph.
Fertility rates by education and race/ethnicity
Data Rule: If everyone believes it, it may not be true. One of the purposes of data is to tell us what is actually true, as opposed to what we believe. I was a bit surprised when I ran into this quote from an IFS article (1/31/2024)
First, it is not the most educated women who have the fewest children. In the United States, women with a bachelor’s degree average 1.284 children apiece, while those with a master’s degree average 1.405, and those with a doctorate or professional degree average 1.523.1 Admittedly, women whose education ends short of the bachelor’s degree have even more children than PhD holders: as education goes up, fertility goes down, but only up to a point. And that point for American women is the bachelor’s; after that, as education goes up, fertility increases.
I clicked the link in the quote, and that took me to a 2021 CDC report where I found this graph:

The quote above gives total fertility for all groups, while this graph breaks it down by race and ethnicity. It turns out that both White and Hispanic women’s fertility goes up from an associate’s degree through a Ph.D. On the other hand, Black women’s fertility continues to go down. Why? I don’t know, but I expected fertility to continue to drop as education went up. Now, it is still the case that as soon as a woman has some college education, fertility rates drop below replacement, while those with a high school education or less are above replacement, except for White women with a high school degree. This is all worth noting and keeping in mind.
Another 140 acers to a data center
Ok, maybe this is an odd obsession of mine at this point. Still, I’ll note this from DCD (1/25/2024)
Amazon has acquired more land in Virginia’s Prince William County.
Citing county property records, BizJournal reports Amazon Data Services Inc., recently paid $152 million to acquire roughly 140 acres across four parcels in Manassas.
How to service a nuclear war
Take a look at the graph here from the paper Seaweed as a Resilient Food Solution After a Nuclear War (1/9/2024).
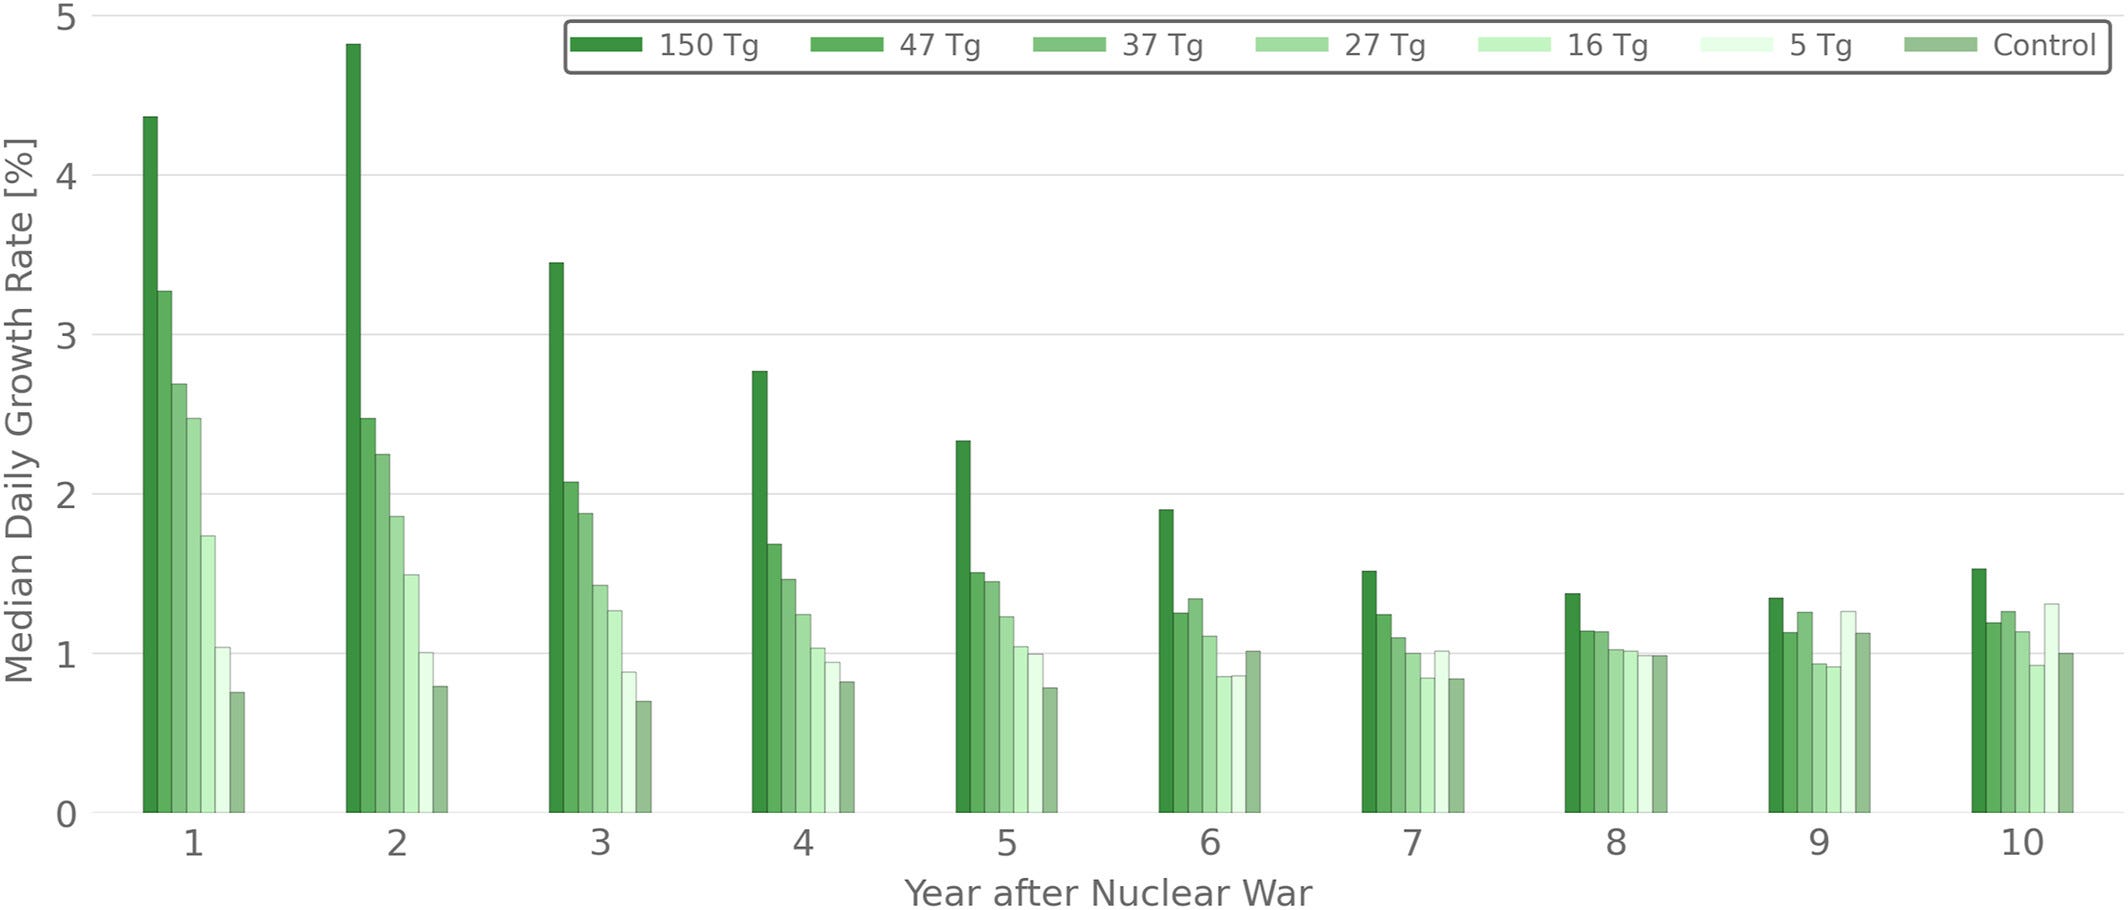
You read that correctly. Seaweed growth rate increases as more severe the nuclear fallout (tg is teragrams of soot ejected).
Our study demonstrates that seaweed can play a significant role in meeting human food demands following a severe nuclear war. Our findings indicate that a scaled-up seaweed production of 45% of human food demand is possible in as little as 9 months. However, the results also show that the global median of seaweed growth is smaller in less severe nuclear exchanges, as fewer nutrients reach the surface waters of the ocean, limiting seaweed growth (Figure 1). However, this does not mean that scale-up might be slower in those cases (Figure S6 in Supporting Information S1), as in all nuclear war scenarios there are wide areas in the oceans with high growth rates. The limiting factor is the speed of the global scaleup in the construction of new seaweed farms and not the growth rate. For the more severe scenarios a slightly longer scale-up is needed, to account for the fact that the growth rate experiences a lower dip in year three, which was to be compensated with a bigger area. Still, this means that seaweed could be a viable addition to global food security now and in severe abrupt sunlight reduction scenarios, but also in smaller nuclear exchanges and volcanic eruptions.
You can sleep well knowing that you won’t starve if you survive a nuclear attack. Too dark?
Penguins
I find it amazing that we still discover something like four new penguin colonies, as discussed in Four unreported emperor penguin colonies discovered by satellite (1/20/2024).

In 2019, eight previously unreported emperor penguin breeding sites were found using the European Space Agency's Sentinel-2 satellite, a medium-resolution satellite with a spatial resolution of 10 m per pixel (Fretwell & Trathan 2021), bringing the number of known extant breeding locations to 61. Here, I report on the discovery of a further four breeding sites using Sentinel-2 and Maxar WorldView-2 imagery.
Black market sand
If pirating doesn’t work for you (see last week’s Quick Takes) then maybe black market sand might work for you. Scientific America reports (2/1/2024):
Luis Fernando Ramadon, a federal police specialist in Brazil who studies extractive industries, estimates that the global illegal sand trade ranges from $200 billion to $350 billion a year—more than illegal logging, gold mining and fishing combined.
The demand and price for sand have been increasing, largely due to increased construction, as sand is needed for concrete.

Each year, we use “up to 50 billion metric tons of sand, according to a United Nations Environment Program report.” The article notes that the world could run out of construction-grade sand by 2050.
My favorite holiday
When I was in grade school, I was friends with one of our German exchange students. He had seen Bill Murray’s Groundhog Day movie but was surprised when February 2 rolled around and he found out Punxsutawney Phil was a real groundhog. As much as I love Phil, we really should check the data. Not surprisingly, it turns out that Phil isn’t very good at his job. On the other hand, maybe it is a surprise that NOAA’s NCEI made this infographic last year; actually, they updated it from a previous post:

Phil has only been right 40% of the time in the last 10 years. A bit of internet sleuthing suggests that if we go back farther than 10 years, Phil’s success rate is even worse. Whatever Phil says tomorrow, odds are you should bet against Phil.
Bad headline
The Guardian has this headline: Every year spent in school or university improves life expectancy, study says (1/23/2024). No, we don’t have causation. So this is silly (bold mine).
It also implies that increases in the school leaving age and rising numbers of young people staying on into further and higher education could add years to future levels of life expectancy.
Those who do and don’t go to college are not randomly chosen, and so the word could here is doing a lot of work. The study they reference is a meta-study, and they list a number of limitations. For example:
Perhaps most notably, we did not include measures of socioeconomic status, such as wealth or income, in the analysis due to the inconsistency in the variable type and presence across input studies.
From the Guardian piece (bold mine):
Neil Davies, professor of medical statistics at University College London and an expert on the links between education and health who was not involved in the research, described it as “an impressive piece of work”.
But Davies cautioned that associations seen in the past may change, given the UK’s recent expansion in higher education and other factors such as the decline in smoking so that rates are now similar among graduates and non-graduates.
There is obviously a strong bias in places like the Guardian to favor higher education. My first issue here, as noted, is that we don’t have causation. My second is that it isn’t feasible or desirable, for a variety of reasons, to send every person to college. So, what do the folks at the Guardian want to do to improve health outcomes for these people? It is easy to write an article to say, Just send everyone to college. It is much harder to find other solutions.
Business profitability by race or ethnicity
This comes from the Census Bureau (1/25/2024). I’m concerned here about the fact that the CB published this graph without any context, as what it will do is fuel race wars. Are there differences in the types of firms each group starts? The age at which they start it? The location? Etc. We shouldn't be lazy here and just assume racism without more context and knowing other factors.

The spinning CD
A little country this week. Conner Smith, Smoky Mountains
Please share and like
Please help me find readers by forwarding this article to your friends (and even those who aren't your friends), sharing this post on social media, and clicking like. If you're on Twitter, you can find me at BriefedByData. If you have any article ideas, feedback, or other views, please email me at briefedbydata@substack.com.
Thank you
In a crowded media market, it's hard to get people to read your work. I have a long way to go, and I want to say thank you to everyone who has helped me find and attract subscribers.
Disagreeing and using comments
I'd rather know the truth and understand the world than always be right. I'm not writing to upset or antagonize anyone on purpose, though I guess that could happen. I welcome dissent and disagreement in the comments. We all should be forced to articulate our viewpoints and change our minds when we need to, but we should also know that we can respectfully disagree and move on. So, if you think something said is wrong or misrepresented, then please share your viewpoint in the comments.