Quick takes and random stuff, February 15, 2024
Cliodynamics, natural gas, two Gallup polls, male psychologists, and more
Graph of the week
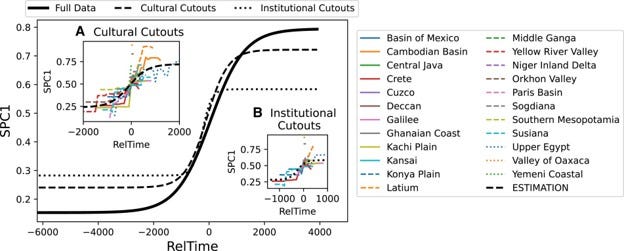
The graph here is from the paper The characteristic time scale of cultural evolution (2/2/2024). Read below to help understand it.
First, the paper’s statement of significance
Do human societies experience cultural evolution on similar time scales? Here, we analyze the Seshat: Global History Databank, which contains quantified historical and archaeological information from a global sample of societies around the world from the last 10,000 years. The first principle component SPC1 summarizes the variation in social complexity, and we show that a universal logistic growth model can be fitted to the SPC1 time series. This model implies the existence of a period of growing social complexity lasting about 2,500 years, with relatively minor changes before or after. These results provide new empirical support to ideas that there are common pathways in human social evolution across past cultures.
The main growth period of the logistic curve in the figure is about 2500 years. This will give a general sense of the data.
The Seshat: Global History Databank includes systematically coded information on over 35 Natural Geographic Areas (NGAs) and over 200 variables across up to 10,000 years in time steps of 100 years ((25, 27); see also publicly available data at http://www.seshatdatabank.info/databrowser/). During the time interval captured by the Seshat databank, these NGAs are occupied by over 370 different identifiable polities, defined as an “independent political unit.” This sample is constructed by identifying all known polities that occupied part or all of each NGA over time (24–26). The recorded variables are aggregated into nine complexity characteristics (CCs) and a principal component analysis shows that 77% of the variation in the data can be explained by the first principal component (SPC1), which has almost equal contributions from all nine CCs (5).
This falls under the emerging field of cliodynamics, which I think is really interesting.
Political party shifts and U.S. education division
Gallop has an article, Democrats Lose Ground With Black and Hispanic Adults (2/7/2024), summarizing party identification by a variety of factors. These three bullet points are worth noting:
The Democratic Party's wide lead over Republicans in Black Americans’ party preferences has shrunk by nearly 20 points over the past three years.
Democrats' leads among Hispanic adults and adults aged 18 to 29 have slid nearly as much, resulting in Democrats' holding only a modest edge among both groups.
Whereas Democrats were at parity with Republicans among men as recently as 2009, and among non-college-educated adults as recently as 2019, they are now in the red with both groups
There was a time that Democrats thought that once Whites were in a minority, they would never lose an election. This was, of course, under the assumption that nothing would ever change in either people’s views or party messaging. This doesn’t seem to be going so well anymore.
But what really got my attention was this graph on party preference by education level.
For those with education beyond four years of college, party identification is nearly 65% Democrat vs. 35% Republican. This is a large gap. If you have a college degree, it is 52.5% vs. 48.5%. Almost even. Once someone doesn’t have a college degree, then the lean is Republican—nearly 55% vs. 45% for those with a high school degree, and even more of a spread without a high school degree. The trends since 1999 are also clear: Democrats are losing those without a high school degree and gaining those with a postgraduate degree.
The divide by education is stark and probably not good for the country. Worse, those with all that education seem to have little interest in trying to understand those without all that education (see the last part of my Guns and female homicides, 2/13/2024, post for a clear example).
The world will keep using fossil fuels
The eia projects that India will triple its consumption of natural gas by 2050 (2/14/204).
We project that India’s industrial sector—in particular, ammonia production intended to decrease fertilizer imports—as well as a growing oil refining sector will drive most of the growth in natural gas consumption over the projection period. This growth in demand will require more significant increases in India's domestic natural gas supply and imports than in recent years.
Part of the demand is due to India’s population growth, as they have a lot of people to feed. I would imagine most countries want as much energy and food security as possible, as well as an increased standard of living. This all leads to consuming more energy in whatever form is most affordable.

Would you vote for a candidate if…
Gallup asked voters questions about whether they would vote for a candidate if they had a certain characteristic (1/26/2024). These are the results by party.
If you asked this question 50 years ago, I’m guessing there would be much fewer yeses for Black candidates. There is much less racism than in the past, and even 88% of Republicans would vote for a Black president. We can make a similar statement for women.
On the other hand, when do atheists get protected status? Even 30% of Democrats say they wouldn’t vote for one. I guess inclusivity has some limits for even Democrats. Why were Asians not on the list? Leaving Asians off this list seems really strange.
I’m guessing Trump has influenced the charged or convicted of a felony question. I suppose I wouldn’t vote for someone charged with a felony if the outcome of the trial was pending. But if someone has been convicted and served their time, why are Democrats so opposed to voting for them? Or, once more, is Trump influencing the response here? I’ll note that the question wasn’t asked that way, but I’d assume that if someone is a party candidate, then they aren’t in jail.
Cool video
During the April 8, 2024 total solar eclipse, the Moon's umbral shadow will fly across North America, from Mazatlán on the Pacific coast of Mexico to eastern Canada's island of Newfoundland, in a little less than two hours. The path of this shadow, the path of totality, is where observers will see the Moon completely cover the Sun for up to four and a half minutes.
Where have all the male psychologists gone?
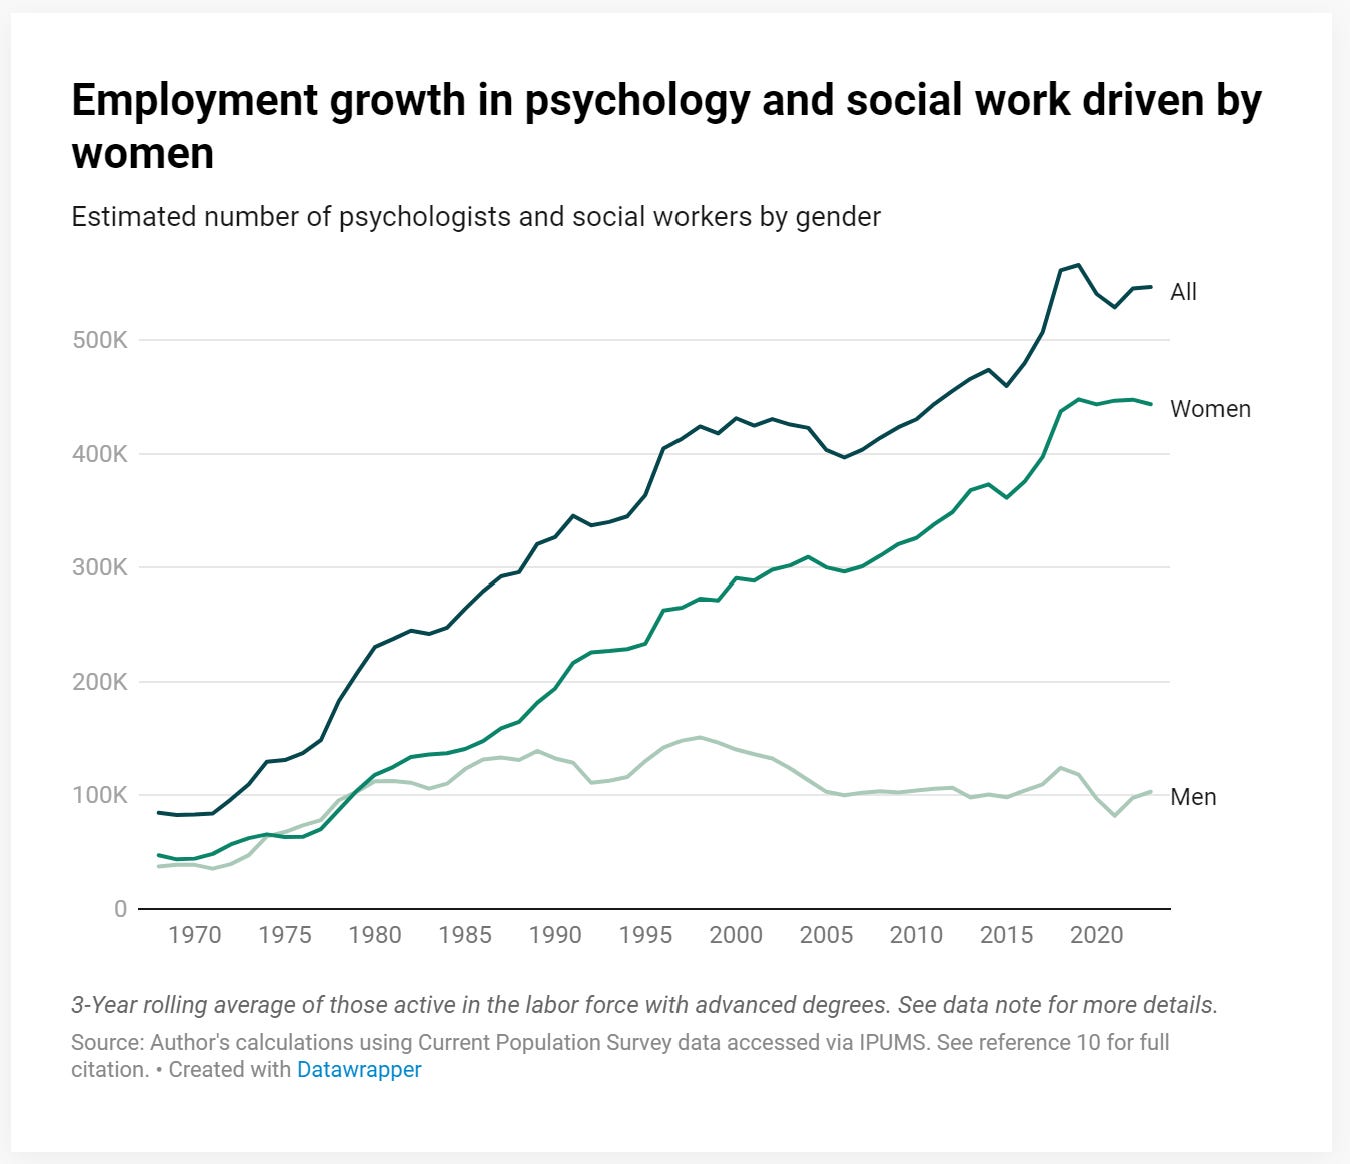
These two graphs come from the article Where Are the Men? Male Representation in Social Work and Psychology (1/24/2024). The first shows how the percentage of male psychologists and social workers has declined. The drop in the percentage of male psychologists over 50 years is dramatic.
Hopefully you are asking if this is a drop in the actual number of just more female psychologists and social workers. The number of male psychologists and social workers has been stable since 2005.
Is this a problem? The article suggests it is including to build “a representative field informed by varied perspectives.” Here is where I think higher education has been shooting itself in the foot. There are numerous programs to encourage women into STEM fields. There are little to no similar programs for fields that are disproportionately women. If you think women in STEM are important because maybe you believe it is important to build “a representative field informed by varied perspectives,” they should be consistent. Women have been a majority in college since 1980, there are a few programs encouraging men in fields where they are underrepresented. The hypocrisy is obvious and well known, and it is a bad look for higher education.
Two graphs from the NY Fed
Auto loan delinquency rates are up (2/6/20240).
Debt it up but the data here is not normalized in any way.
Their comments on this graph (bold mine)
Mortgage balances shown on consumer credit reports increased by $112 billion during the fourth quarter of 2023 and stood at $12.25 trillion at the end of December. Balances on home equity lines of credit (HELOC) increased by $11 billion, the seventh consecutive quarterly increase after 2022Q1, and there is now $360 billion in aggregate outstanding balances. Credit card balances, which are now at $1.13 trillion outstanding, increased by $50 billion (4.6%). Auto loan balances increased by $12 billion, continuing the upward trajectory that has been in place since 2020Q2, and now stand at $1.61 trillion. Other balances, which include retail cards and other consumer loans, grew by $25 billion. Student loan balances were effectively flat, with a $2 billion increase and stand at $1.6 trillion. In total, non-housing balances grew by $89 billion.
The spinning CD
From the Struts
Please share and like
Please help me find readers by forwarding this article to your friends (and even those who aren't your friends), sharing this post on social media, and clicking like. If you're on Twitter, you can find me at BriefedByData. If you have any article ideas, feedback, or other views, please email me at briefedbydata@substack.com.
Thank you
In a crowded media market, it's hard to get people to read your work. I have a long way to go, and I want to say thank you to everyone who has helped me find and attract subscribers.
Disagreeing and using comments
I'd rather know the truth and understand the world than always be right. I'm not writing to upset or antagonize anyone on purpose, though I guess that could happen. I welcome dissent and disagreement in the comments. We all should be forced to articulate our viewpoints and change our minds when we need to, but we should also know that we can respectfully disagree and move on. So, if you think something said is wrong or misrepresented, then please share your viewpoint in the comments.


