Quick takes and random stuff Jan 25, 2024
Earthquakes, global temperatures, corporate profits, pirates, women and men's wages, and more
Graph of the week
I teach a GIS course, and so I appreciate a well-done map. This one is self-explanatory and from The 2023 US 50-State National Seismic Hazard Model: Overview and implications (12/29/2023). If you aren’t a fan of earthquakes, avoid living in the red. I’m in the blue, so I’m good. It is also worth noting that the population centers are generally at lower risk, except for the west coast.
How hot was December 2023?
With El Niño in play, it is no surprise that December set a record for global temperature, but the anomaly wasn’t as large in November. Again, it isn’t officially an El Niño month yet, but it will be.

Here is what NOAA has to say in its monthly report:
The Northern Hemisphere had its warmest December on record by a wide margin at 1.98°C (3.56°F) above average. This surpassed the previous record set in 2022 by 0.82°C (1.48°F). Both land and ocean temperatures were at record-highs for the Northern Hemisphere this December. The Arctic region had its second-warmest December on record.
December 2023 in the Southern Hemisphere also ranked warmest on record at 0.88°C (1.58°F) above average. While the average ocean-only temperature for December in the Southern Hemisphere ranked highest on record this December, land-only temperature was fourth warmest on record. Meanwhile, the Antarctic region had its 48th-warmest December.
Here is an update with all the months on the same graph. It isn’t a surprise that 2023 was a record year due to the number of months that were El Niño. I won’t give a yearly anomaly graph because it is misleading. ENSO is assigned to months, not years, and I’ll keep repeating that there are three distinct trends here based on ENSO status. For that matter, talking about targets for global average temperature makes little sense unless it is carefully stated. For example, is the 1.5°C target something we have to stay below all the time, an average to stay below over some time period like a decade, or is it ok to stay below 1.5°C in years with little to no El Niño months but go above in years with a number of El Niño months?

One thing to keep track of in the next year or two, as we are likely to move to a La Niña period, is the talking points around the global average temperature. If you look at the graph above, you will see that La Niña periods following El Niño periods have much lower anomalies. The left has been able to ramp up the climate alarmism, and so the right will get its time to say warming has stopped, slowed, or whatever. Neither side is being particularly honest about how warming is happening.
Bad news for BEVs
This heading from the NYT largely says it all: Electric Car Owners Confront a Harsh Foe: Cold Weather (1/17/2024). Interesting fact:
Unlike cars with internal combustion engines, an electric vehicle has two batteries: a low-voltage and a high-voltage. In particularly cold weather, the lower-voltage, 12-volt battery can also lose charge, as it does in traditional vehicles.
When that happens, the E.V. cannot charge at a fast charger until the low voltage battery has been jump-started, said Albert Gore III, a former Tesla employee who is now the executive director of the Zero Emission Transportation Association,
This won’t encourage EV sales in colder climates.
In normal conditions, Ms. Rivera’s car can drive up to 273 miles on a single, 30-minute charge. This week, Ms. Rivera said she has awakened to find about a third of her car battery drained from the overnight cold. As temperatures plummeted, she spent hours every morning waiting in line and recharging the battery.
Now the article does point out the places like Norway have dealt with, but it does mean two things. First, owners of BEVs have to be educated and learn how to deal with their cars in cold weather. The second is that charging stations will have to be overbuilt in colder areas to handle these cold spells. In other words, there is a greater cost of infrastructure in colder areas. All this is going to take longer than some folks would like to admit.
Corporate profits per hour worked
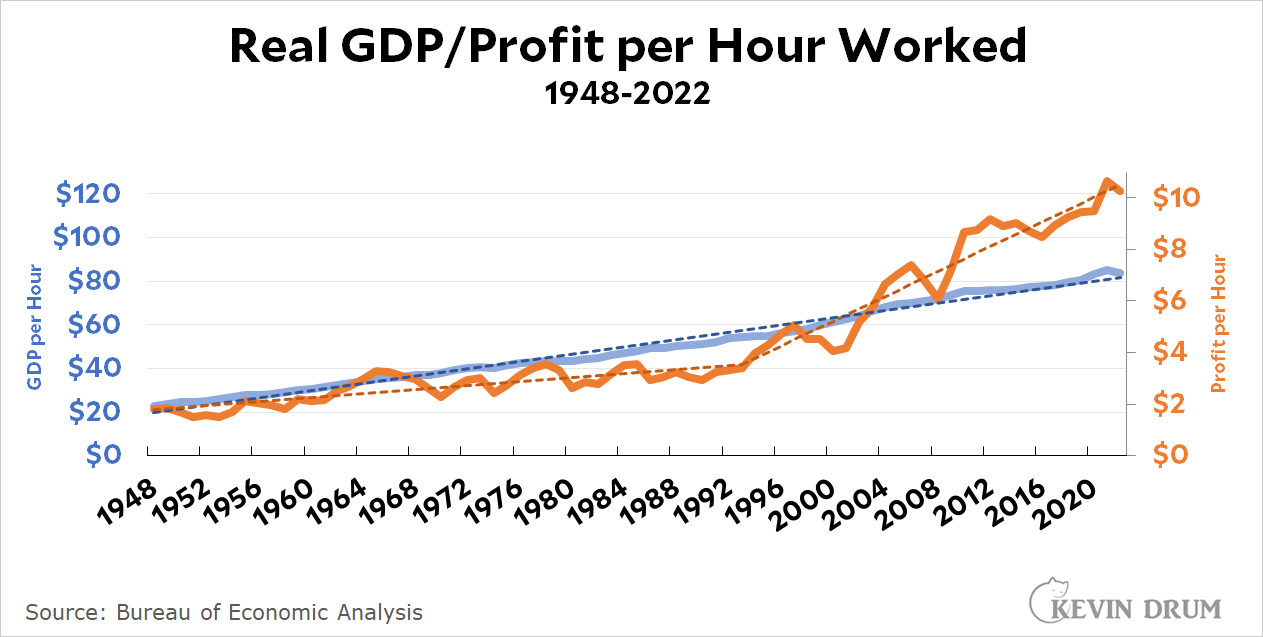
Drum has this great graph I haven’t seen before in his post Three random charts about US economic growth (1/22/2024). Generally speaking, worker productivity has been increasing. The blue line is GDP per worker hour. It has gone from $20 to $80 from 1948 to 2022.
The orange line is what is interesting. It is corporate profit per worker hour. Here is what Drum says:
For 50 years after World War II, corporate profits (adjusted for inflation) grew at a rate of 2% per year. Then, starting in the early 90s, profits suddenly took off, growing at a rate of more than 4% per year.
What happened in 1993 to cause this? In only 30 years corporate profits per hour worked have tripled. That's quite a trick.
In other words, increases in worker productivity seem to have gone more to corporate profits and hence less to workers starting around 1990 or so. This is a great example of the data rule Normalize properly; ask, "Per what?” Corporate profit per worker hour is an excellent metric.
It is worth considering the impact of this on society overall. This is one driver of increasing economic inequality. It seems obvious to me that some inequality is good, but too much is bad. The question is, how much is too much?
More bad press for higher education
This comes from Inside Higher Ed (1/23/2024):
The lawsuit was brought by a group of former students against 17 institutions known as the 568 Presidents Group, a reference to a carve-out in the Improving America’s Schools Act of 1994 that allowed them to discuss financial aid formulas with immunity from federal antitrust laws due to their need-blind status. However, plaintiffs have alleged that the 17 need-blind institutions considered family finances in admissions decisions, which ultimately amounted to illegal collusion on financial aid formulas. The universities are accused of favoring affluent applicants and ultimately overcharging students for tuition and fees for years.
So far, eight institutions have settled for a total of $151 million. This shouldn’t come as a big surprise. College admissions is a bit of a game with a number of bad incentives. Colleges want to keep the admissions rate down so they look as selective as possible. Some students get rejected because a college is convinced they likely won’t attend if accepted. This is part of keeping the acceptance rate down. Colleges also have to pay their bills, so a student who has the ability to pay more is going to be favored over one who needs a lot of financial aid.
Long live the pirate
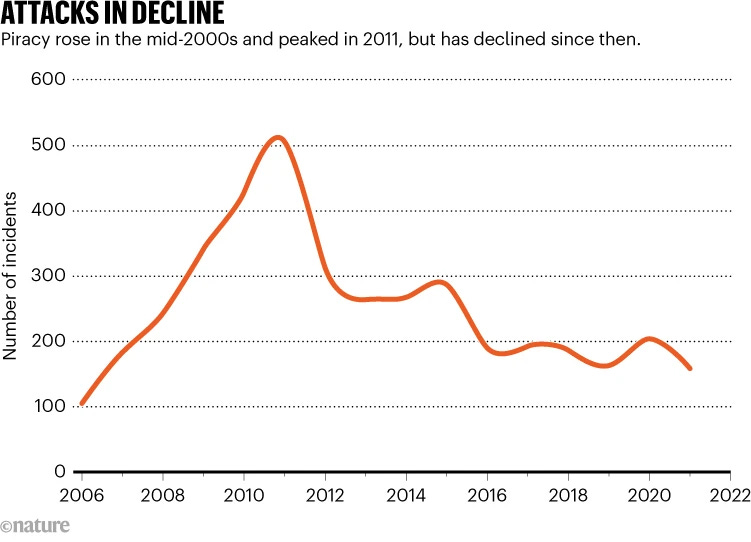
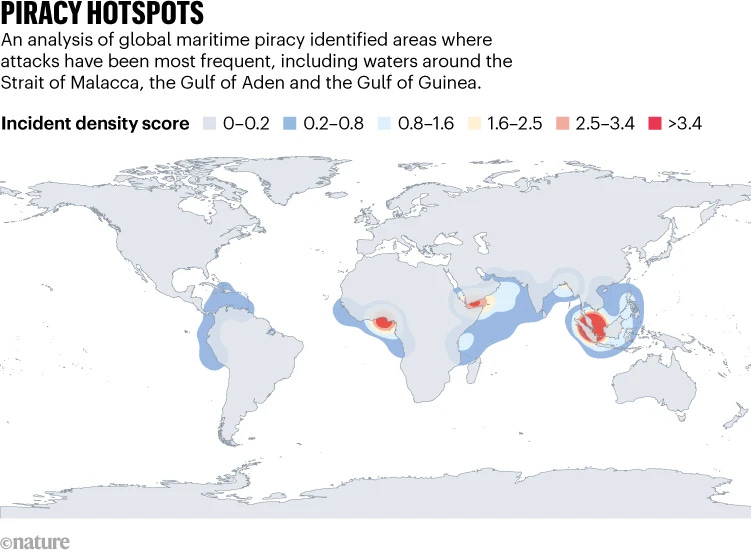
These graphs comes from the Nature article Piracy at sea is waning — but hotspots remain (1/17/2024). The first is the yearly number of pirate incidents. I have nothing insightful here; I just found this curious.
There is also a map of piracy hot spots. If you are interested in starting your own pirate business, you might want to pick an area that doesn’t have many pirates already in business.
Just in case you don’t know what a pirate is, here is a fun fact about the importance of shipping:
Ocean shipping is responsible for moving up to 90% of all internationally traded goods. But every year, dozens of ships come under attack from pirates: bands of maritime marauders that attempt to board ships moving through international waters to seize goods or hold crew members for ransom.
How much are fossil fuels worth?
I got it into my head that I wanted to know what the fossil fuel industry is worth. A couple of quotes based on what I found for now. The first is from Research Dive (April 2023)
The Global Fossil Fuel Energy Market Size was $6,263.60 billion in 2021 and is predicted to grow with a CAGR of 5.3%, by generating a revenue of $10,646.50 billion by 2031.
The second is just the title of a Bloomberg article (1/25/2023) that is behind a paywall.
Fossil Fuel Profits Roar Back, Producing 10% of S&P 500 Earnings
My point here is to continue to try and quantify how valuable the fossil fuel industry is to our economy. The values here speak to both the power these companies have as well as how important they are to our economy. They aren’t going away quickly or quietly, and if they did, who would lose all this money? How many retirement funds would take a big hit?
Trends in women's and men's wages
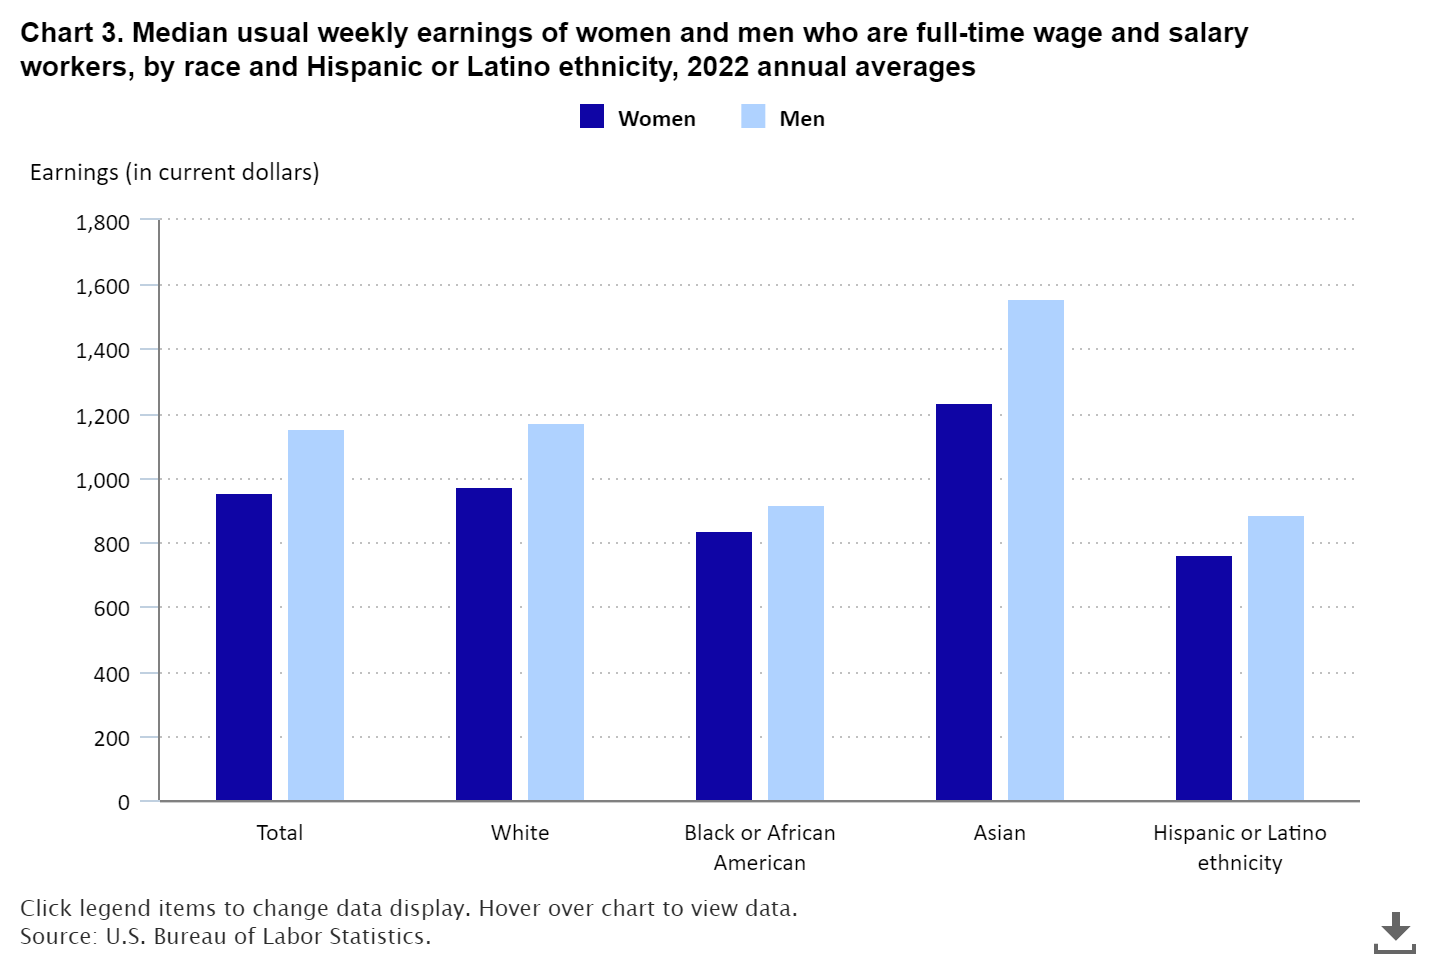
The BLS report Highlights of women's earnings in 2022 (January 2024) provides data comparing women's and men's earnings in a variety of ways. The overall statement is that “women who were full-time wage and salary workers had median usual weekly earnings that were 83 percent of those of male full-time wage and salary workers,” but if you read below the graph, they say this:
The earnings comparisons in this report are on a broad level and do not control for many factors that can be important in explaining earnings differences, such as job skills and responsibilities, work experience, and specialization.
This is one of my basic data rules: avoid making assumptions based on a single factor. A statement like this should be much more prominent because the media will just run with the main comparison. I do want to comment on two charts. The first is the change in earning by education.
I think people are more sensitive to change than absolutes. Men might make more in general, but males without a degree have seen their wages decrease while women's wages have increased. This will make for a lot of disaffected males, even if they are still making more than women. Even those with college degrees are seeing women's wages increase more than theirs.
The second chart worth mentioning is the difference by race. Asian men make more than everyone else. What is interesting is how we should view Asian women. On one hand, they make more money than every group represented, including males of all other races or ethnicities. Yet, Asian women earn only 79% of Asian males. Why? I don’t know, but culturally related choices must play a role. If Asian women can make more than White males, then why can’t White females?
The spinning CD
A second one from the forthcoming Bleachers album. Tiny Moves.
Please share and like
Please help me find readers by forwarding this article to your friends (and even those who aren't your friends), sharing this post on social media, and clicking like. If you're on Twitter, you can find me at BriefedByData. If you have any article ideas, feedback, or other views, please email me at briefedbydata@substack.com.
Thank you
In a crowded media market, it's hard to get people to read your work. I have a long way to go, and I want to say thank you to everyone who has helped me find and attract subscribers.
Disagreeing and using comments
I'd rather know the truth and understand the world than always be right. I'm not writing to upset or antagonize anyone on purpose, though I guess that could happen. I welcome dissent and disagreement in the comments. We all should be forced to articulate our viewpoints and change our minds when we need to, but we should also know that we can respectfully disagree and move on. So, if you think something said is wrong or misrepresented, then please share your viewpoint in the comments.


