

Quick Takes and Random Stuff - July 27, 2023
lack of trust in news, self-censorship, sea ice, homeownership, marriage helps cancer, reporting professors, and more

We really don’t trust the news
I’m not sure a society can function with such low trust. The media needs to take some responsibility for this.

Conservative self-censorship
The graph here and quote are from the paper Cancel culture: Heterodox self-censorship or the curious case of the dog-which-didn’t-bark. Is anyone surprised that conservatives self-censor themselves more? I think this is bad for society. Self-censorship means that ideas aren’t challenged and adjusted when they are incorrect. No one person or group is correct all the time.
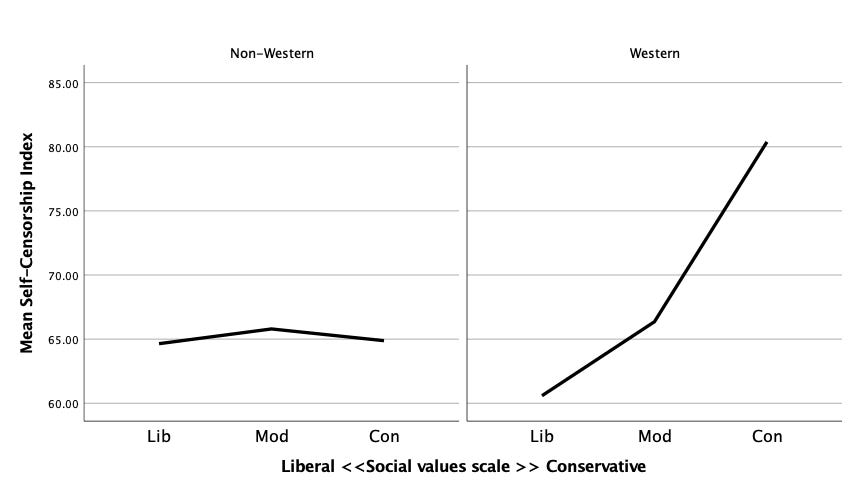
The results demonstrate that in Western societies, with predominately liberal social cultures, the heterodox fish-out-of-water (social conservatives) were significantly more likely to selfcensor their views than the orthodox (liberals), as theorized. By contrast, in non-Western developing societies, characterized by more traditional moral values in society, the respondent’s ideology did not prove a significant predictor of self-censorship. Figure 5 illustrates the contrasts in the mean 100-point standardized Self-Censorship Index (across all contexts) by type of society and type of social and moral values (categorized into Liberal-Moderate, or Conservative), without any controls. As the figure illustrates, in the affluent postindustrial Western societies, with predominant liberal cultures, a substantial 20-point gap in the reported propensity to self-censor can be observed between the orthodox (social liberal scholars) and heterodox (socially conservative scholars). In ANOVA tests, the mean gap between these groups proved statistically significant (Eta=0.071 P0.008). By contrast, in non-Western societies, no significant difference was observed in the propensity to self-censoramong liberal, moderate, and conservative scholars.
Which graph is best?
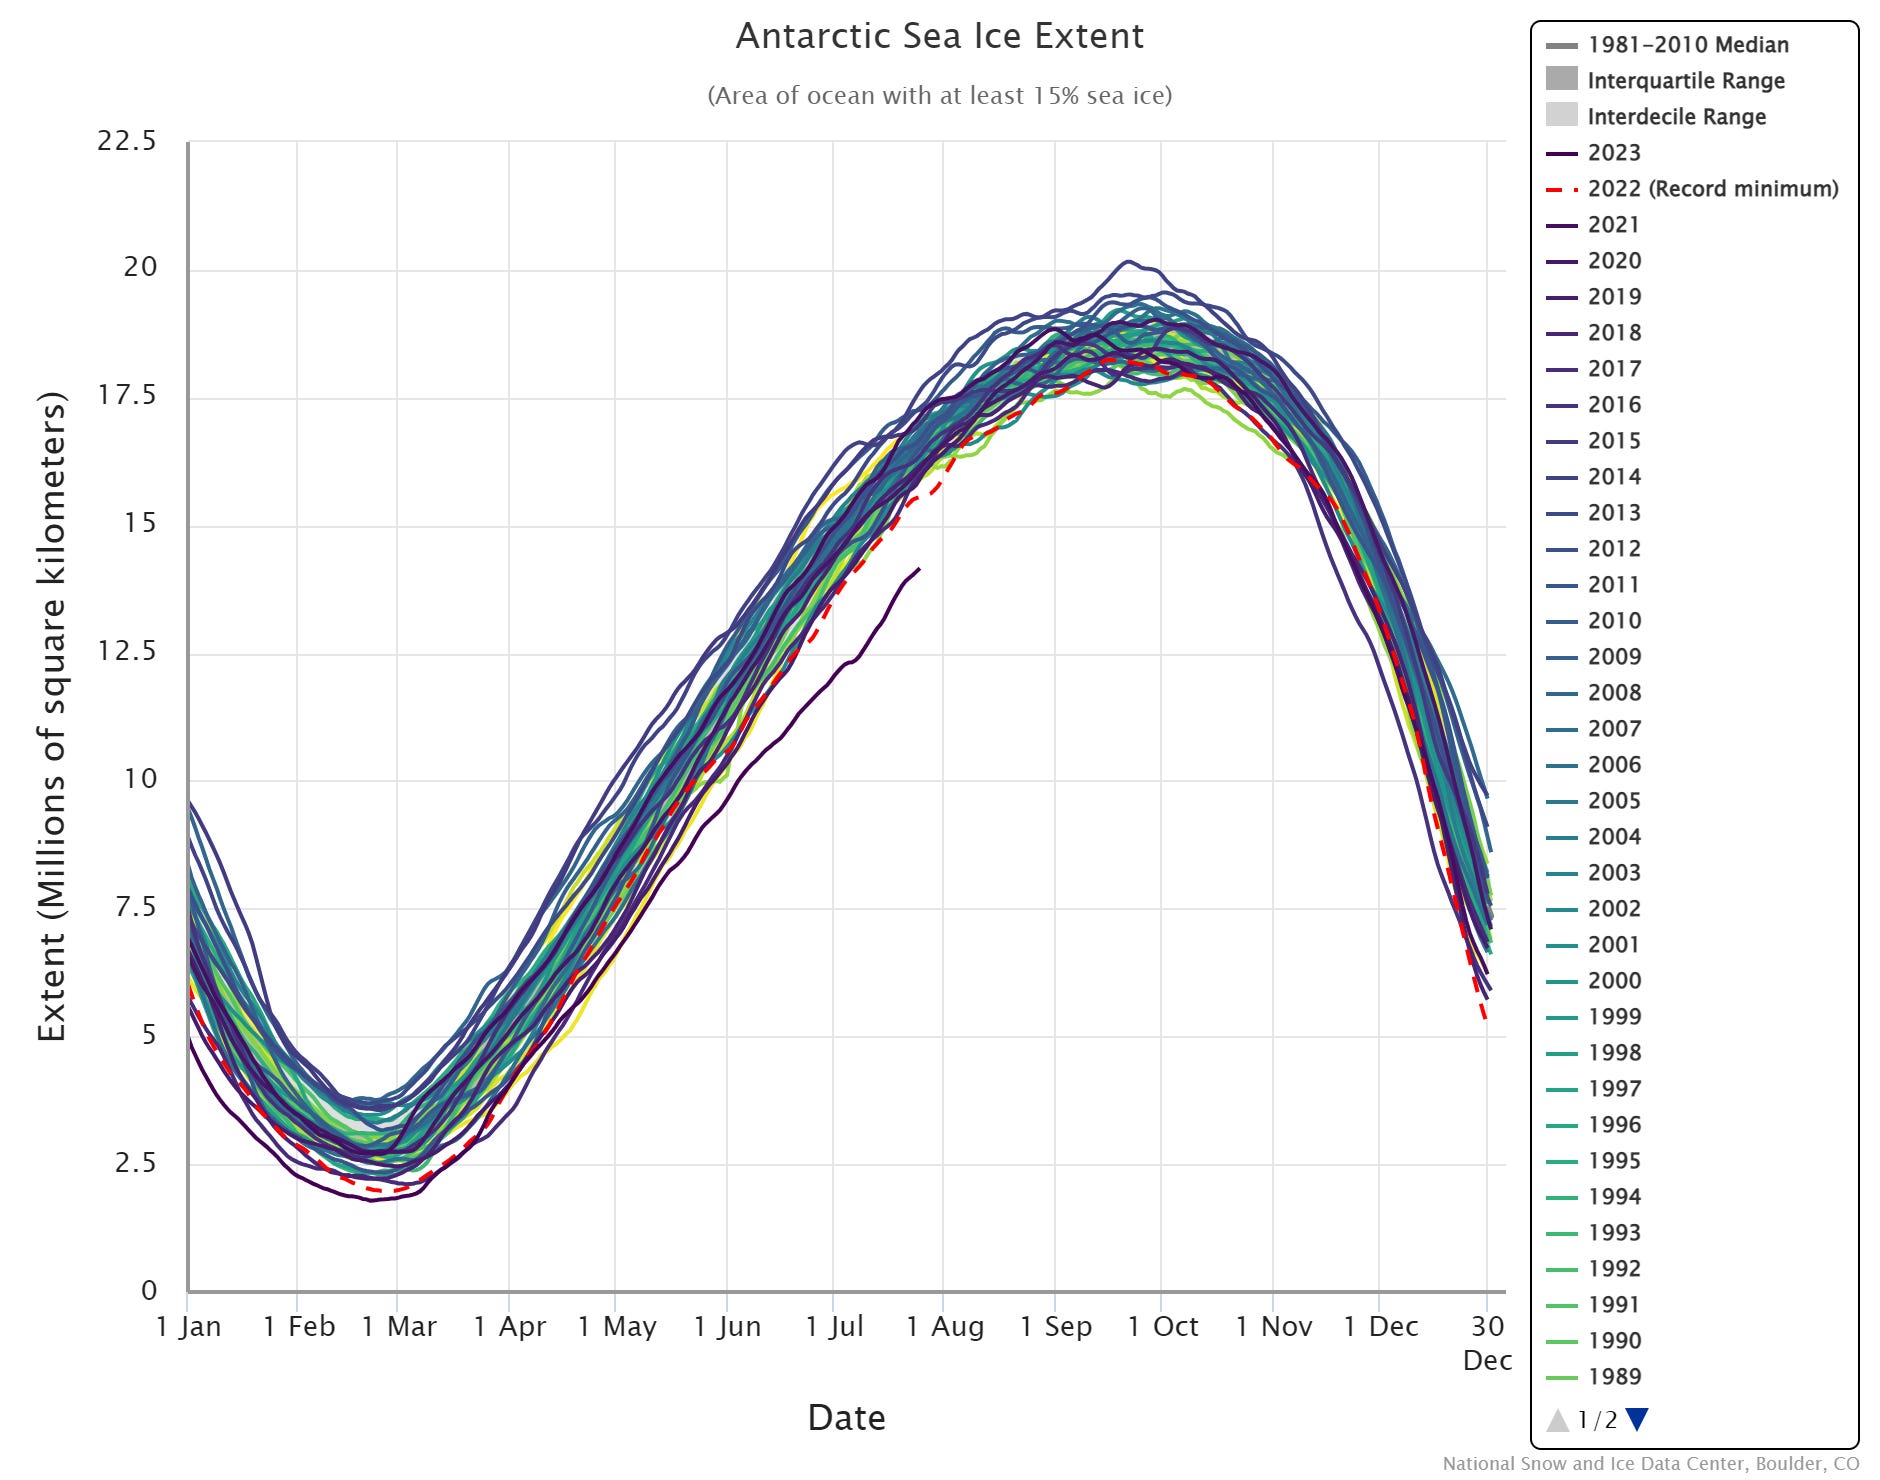
The one above is from the NSIDC and shows the Antarctic sea ice extent. The curve below the others is this year. Clearly, we are setting record lows for this time of year. The graph makes sense to us, as we intuitively see the ice freezing and thawing. But how off from normal are we this year? The graph below gives the number of standard deviations from the mean for each day. The advantage here is that we have a measurement of how far Antarctic ice is below normal this year. We are 7 standard deviations below the mean. The graph is harder to understand, but it gives us a measure of how far below normal we are. Both graphs have their purposes. Either way, we are seeing something really unusual happening with Antarctic sea ice.

Homeownership is up
Two graphs from the story “Rate of Homeownership Higher Than Before the Pandemic in All Regions” by the Census Bureau. (7/25/2023) The first shows who owns a home by age and how much that rate has increased from 2016 to 2022. The gains are mostly for people under 44. The second is the same kind of graph, but it shows the data by race. All races saw increases in homeownership rates. My one gripe is that this is not adjusted for age and location. White people have higher homeownership rates overall, but they are also older (see U.S. Demographics by Age), so we would expect them to have higher homeownership rates. I'm going to assume that it's harder to own in a city, so we should take that into account. Still, I’ll take both of these graphs as positives.


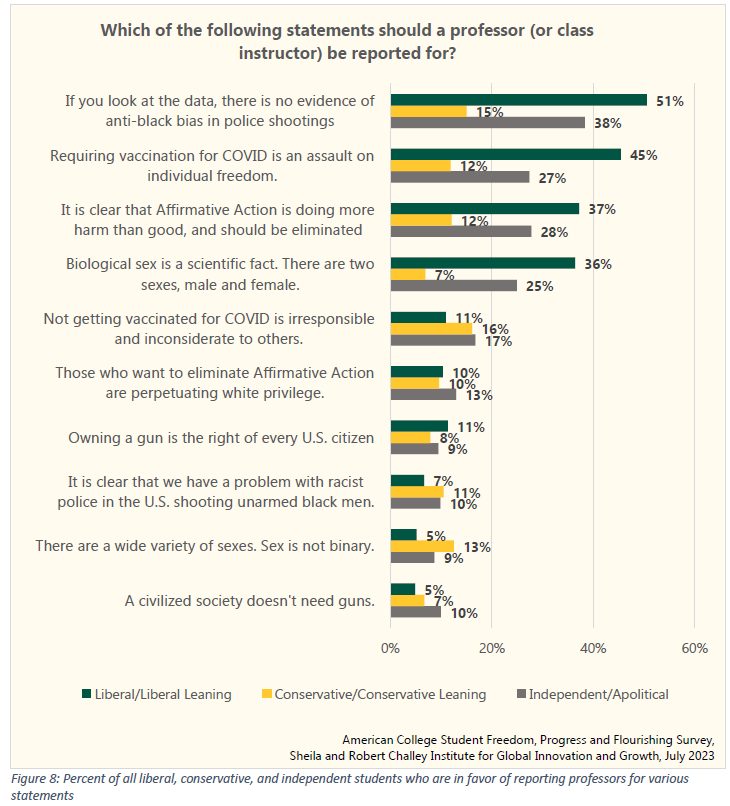
Report the professor
The 2023 American College Student Freedom, Progress, and Flourishing Survey made this chart. As a professor, I'm not surprised by this, and I think it's bad for the conversation on campus. Even if nothing bad happens, it's a pain to be reported. Also, notice the difference between liberal and conservative students. Most students on campus are liberal (see quote from study), and liberal students are easily offended and quick to report.
Concerning political ideology, 58 percent report being slightly, somewhat, or very liberal; 20 percent report being slightly, somewhat, or very conservative; and 22 percent report being neither liberal nor conservative (independent) or not having thought much about politics (apolitical).
Another can’t win
Are biofuels good or bad? Well, from The Guardian
The US biofuel program is probably killing endangered species and harming the environment in a way that negates its benefits, but the US Environmental Protection Agency (EPA) is largely ignoring those problems, a new federal lawsuit charges.
College admissions for the rich
This graph is from the NYT article Behind the Scenes of College Admissions. The chatter is about how the top 0.1% are 2.2 times more likely to be admitted. No real surprise. But what is the story for the 70th to 99th percentile? Why are they below the average?

Marriage cures cancer
Ok, not exactly, but here are the results from the paper Marital Status and Survival in Patients With Cancer (2013 but new to me):
Married patients were less likely to present with metastatic disease (adjusted odds ratio [OR], 0.83; 95% CI, 0.82 to 0.84; P < .001), more likely to receive definitive therapy (adjusted OR, 1.53; 95% CI, 1.51 to 1.56; P < .001), and less likely to die as a result of their cancer after adjusting for demographics, stage, and treatment (adjusted hazard ratio, 0.80; 95% CI, 0.79 to 0.81; P < .001) than unmarried patients. These associations remained significant when each individual cancer was analyzed (P < .05 for all end points for each malignancy). The benefit associated with marriage was greater in males than females for all outcome measures analyzed (P < .001 in all cases). For prostate, breast, colorectal, esophageal, and head/neck cancers, the survival benefit associated with marriage was larger than the published survival benefit of chemotherapy.
and the conclusion
Even after adjusting for known confounders, unmarried patients are at significantly higher risk of presentation with metastatic cancer, undertreatment, and death resulting from their cancer. This study highlights the potentially significant impact that social support can have on cancer detection, treatment, and survival.
Marriage and social support have positive benefits. How much can marriage or similar social support explain different outcomes by race, ethnicity, and socioeconomic groups? There must be more studies about this.
The Barbie speech redone
From Meghan Daum’s I Rewrote the Barbie Speech for a Man. Click and read the rest.

The spinning CD
Another video, Reverie, from Polyphia’s most recent album (about a year ago), Remember That You Will Die.
It is an excellent album. My favorite is Ego Death, featuring Steve Vai (if you know who that is, then that is an indicator of your age).
Please Share
Please help me find readers by forwarding this article to your friends (and even those who aren't your friends) and by sharing this post on social media. If you're on Twitter, you can find me at BriefedByData. If you have any article ideas, feedback, or other views, please email me at briefedbydata@substack.com.
Disagreeing and using comments
I'd rather know the truth and understand the world than always be right. I'm not writing to upset or antagonize anyone on purpose, though I guess that could happen. I welcome dissent and disagreement in the comments. We all should be forced to articulate our viewpoints and change our minds when we need to, but we should also know that we can respectfully disagree and move on. So, if you think something said is wrong or misrepresented, then please share your viewpoint in the comments.