

Quick Takes and Random Stuff - July 20, 2023
Not racism, record temps, confusing graphs, meaningless significance, and more

Not Everything Is Racism
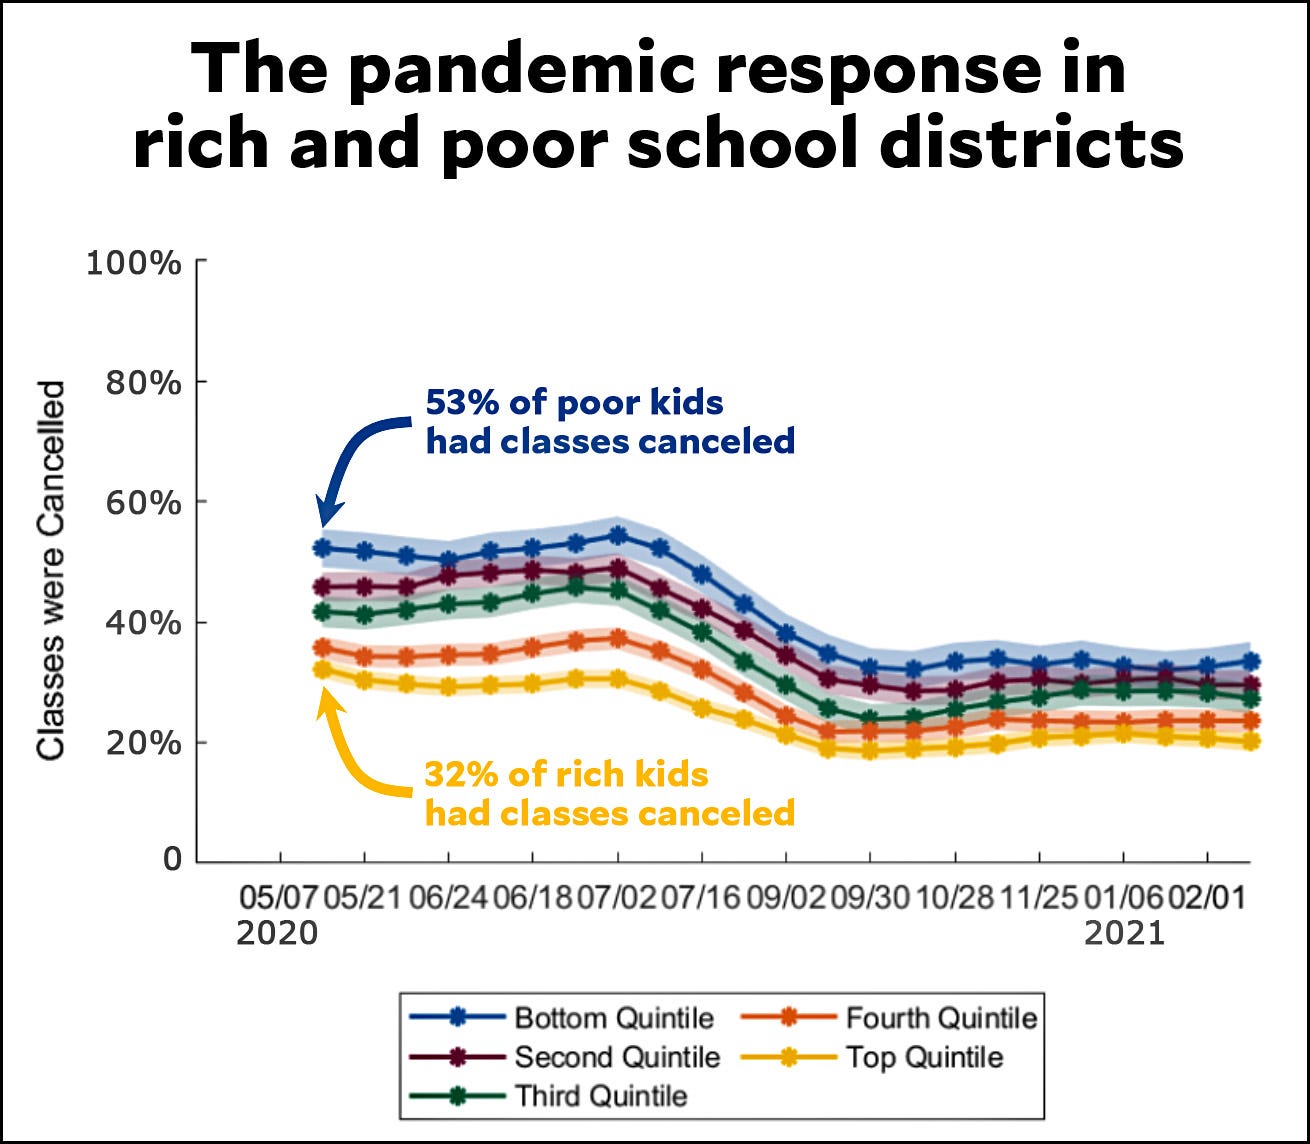
Kudos to Kevin Drum. Earlier in a day, he posted this chart about school closings, saying:
Everyone suffered learning losses during the pandemic, but this research shows part of the reason that poor kids suffered the most. It's because we ignored them more than rich kids.
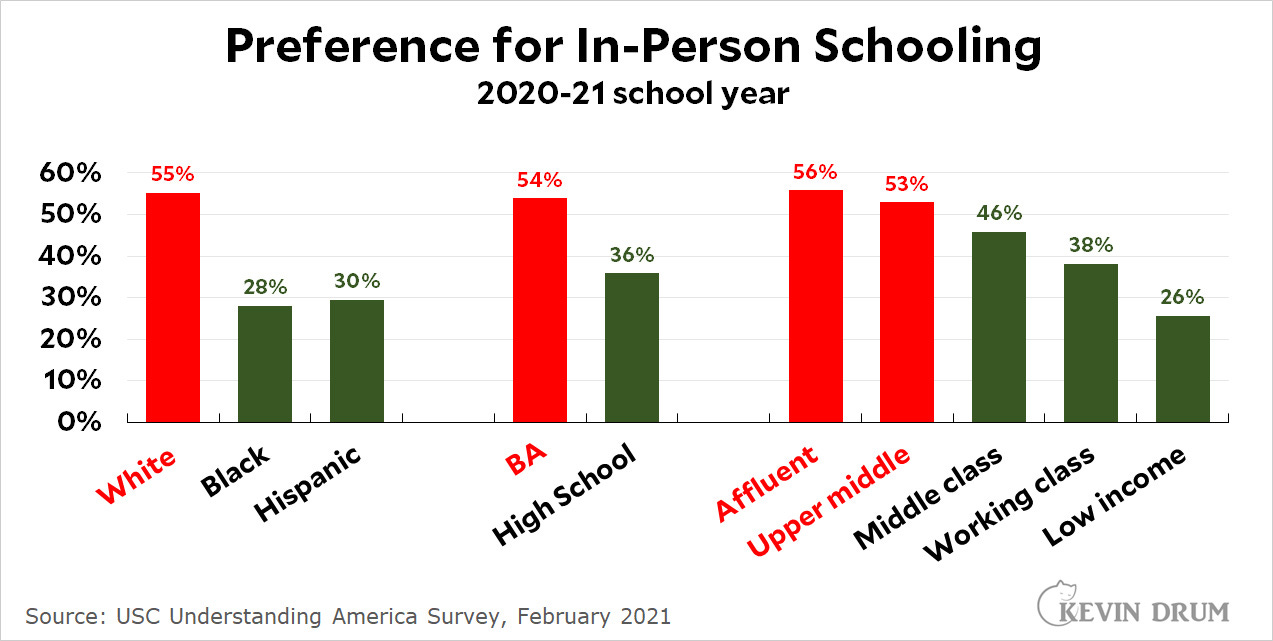
But he is truly curious and later in the day posted this graph, noting
My assumption, naturally, was that this all happened for the usual reason: we just don't care that much about poor Black kids, so they get the short end of the stick. But it turns out that probably isn't true. The real reason for the difference is that poor parents—and Black parents and non-college parents—actively preferred remote learning. They didn't want their kids returning to classrooms during the pandemic.
If you don't think about it after the first graph, you can use it to prove that racism is widespread. It turns out that other factors can explain at least some of the differences between races. As a general rule, you should be wary of "facts" that only have one variable explanation.
One other point about the second graph. Even though child care may have been harder for low-income families, the fact that they chose to keep their kids at home is a bit surprising. For the second graph, it would be nice to have it separated by the children's ages. Anyway, it would be nice if more journalists had Kevin’s curiosity and integrity.
Does Pollution Effect Birth Weight?
Marginal Revolutions summarizes a working paper in the post The Birth-Weight Pollution Paradox.
If pollution reduces birth weight as much as the micro studies on pollution suggest, why aren’t birth weights very low in very polluted cities and countries? Figure 1, for example, shows birth weights in a variety of highly polluted world cities.
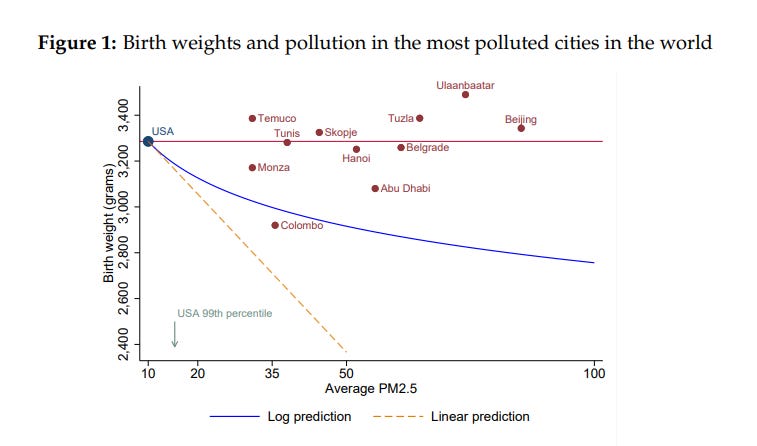
Despite the fact that every one of the highly-polluted cities is much more polluted than the most polluted US city, birth weight is not tremendously lower in these cities. Indeed, there is no obvious correlation between birth weight and pollution at all.
The only thing I'll add is that it's nice to have the mean birth weight, but it would be better to have a distribution. Could it be that there is a bit of a low birth weight tail with more pollution?
Confusing Time Use Data
The BLS provides this graph of time spent in leisure and sports activities. One might think that the subcategories would add up to the total, or maybe there are more categories, so they should sum to less. Unfortunately, the sum is greater. Why?

The key is in the title, “who engaged in the activities.” Watch out for these kinds of details in the data. In other words, make sure you know exactly what the data is measuring. The next graph shows the percentages. The first graph can't be properly interpreted without the second graph. For example, more guys watch TV than women, and when they do, they do it for longer.

Statistical Significance Is Not The Same As Meaningful
From the abstract of Representation in the classroom: The effect of own-race teachers on student achievement
In this paper, we obtain estimates of achievement changes as students are assigned to teachers of different races/ethnicities from grades 3 through 10 utilizing a large administrative dataset provided by the Florida Department of Education that follows the universe of test-taking students in Florida public schools from 2001–2002 through 2008–2009. We find small but significant positive effects when black and white students are assigned to race-congruent teachers in reading (.004–.005 standard deviations) and for black, white and Asian/Pacific Island students in math (.007–.041 standard deviations).
If a data set is large enough, one can easily get statistical significance. In this case, the biggest possible standard deviation is 0.041. To put this in context, suppose a test is out of 100 points, with a mean of 80 and a standard deviation of 10. This improvement would be 0.041 * 10 = 0.4, not even a one-point improvement.
Keeping track of record heat
July continues to stay well above average. The last few days would have been records if they hadn’t already been broken a couple of weeks ago.

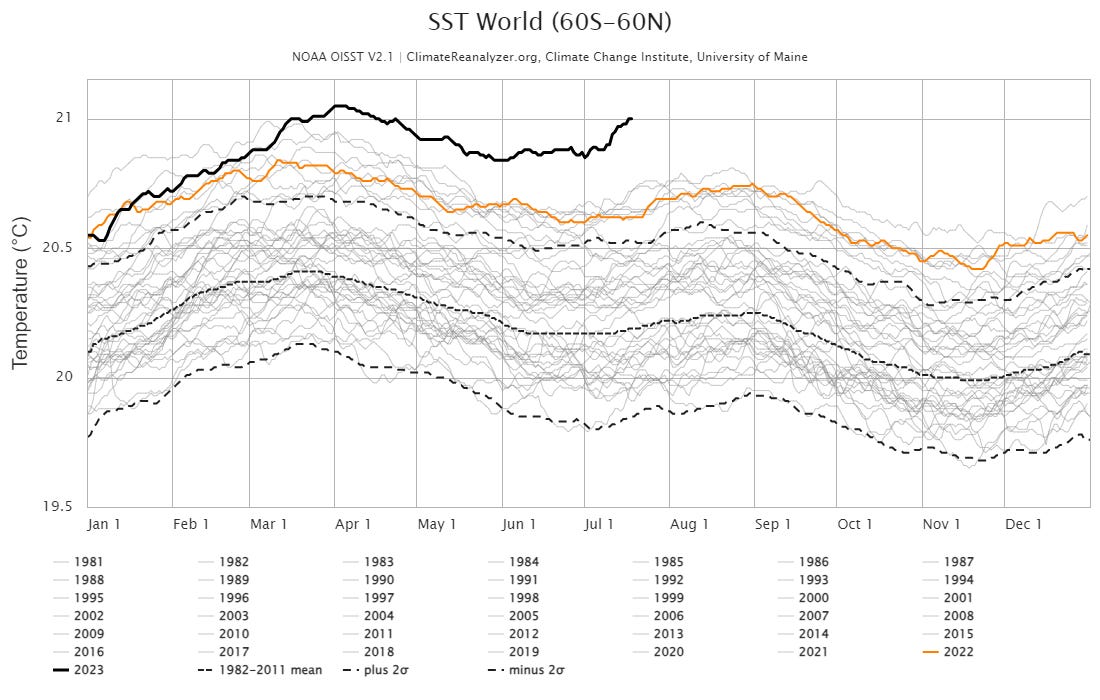
The oceans are also really warm. Note that we are close to setting record high temperatures at a time of the year when the oceans aren’t typically at their warmest.
Save The Ocean Bottom Or Build Electric Cars?
A bit of a conflict of priorities in the Nature article: Deep-sea mining could soon be approved—how bad is it?
Proponents say that this move could help with meeting the growing demand for rare-earth metals used in batteries both for electric cars and for storing renewable energy, aiding the shift to a low-carbon economy. However, research hints that the potential ecological impacts of deep-sea mining are larger than previously thought. Nature explores just how bad deep-sea mining could be.
What is an environmentalist supposed to do?
Good Essay
From The Fitzstack: What’s Wrong With the “what’s Wrong With Men” Discourse - Are men something more than emotionally malfunctioning women?
The difference between the sexes is the most elemental one that exists in our species except for that between adult and child. One of the strange consequences of our coming age of transhumanism is that our attempts to transcend those categories is unintentionally reinforcing how concrete, meaningful and ineradicable they are.
The Spinning CD
New progrock from the Flower Kings: Beginner’s Eyes
Please Share
Please help me find readers by forwarding this article to your friends (and even those who aren't your friends) and by sharing this post on social media. If you're on Twitter, you can find me at BriefedByData. If you have any article ideas, feedback, or other views, please email me at briefedbydata@substack.com.