Race and Ethnicity in 18-24 College Enrollment
A response to a Chronicle of Higher Education Article

The Chronicle of Higher Education article How Diverse Are America’s Campuses? (6/13/2023) makes statements that misrepresent their own data. Here is the first statement:
. . . non-white students are still underrepresented, relative to their share of the population, on college campuses across the nation, with the exception, in many cases, of Asian students and those of two or more races.
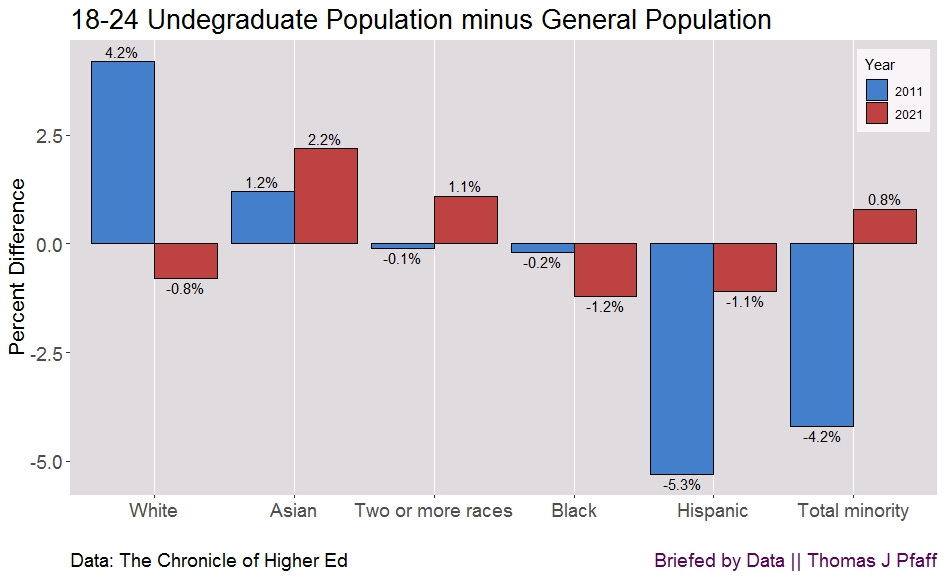
It would appear that this comment is referring to the third graph on their page, which is captioned “Population Has Outpaced Enrollment.” This graph has a significant amount of data, which I have condensed and presented in Figure 1. The overrepresentation or underrepresentation of a group is shown in Figure 1 for both the first year of data collection (2011) and the final year of data collection (2021). It is difficult to get a clear picture of the degree to which they are over- or underrepresented based on their graph, which shows the percentage of each race or ethnicity for odd years from 2011 through 2021.
In Figure 1, you will notice that the entire minority population was underrepresented in 2011 by 4.2%, but by 2021, it was overrepresented by 0.8%. As expected, the numbers for the white population are in the opposite order. This does not mean that “non-white students are still underrepresented.” According to the information that they have, the contrary is true, and it started happening in 2019. It would seem that the authors of the essay would consider something like this to be a successful outcome. In addition, the only non-white demographic to experience a decline was the Black population, which moved from under 0.2% to under 1.2%.
The second statement is in the title of this same graph, their third graph:
Over a 10-year period, Black and Hispanic students made up smaller shares of undergraduate enrollment relative to the shares of 18- to 24-year-olds from those racial and ethnic groups in the general population.
In a strict sense, this is correct; all that is being said is that Black and Hispanic students were underrepresented in each year's data. Yet, the Hispanic population going from down 5.4% to down only 1.1%, as seen in Figure 1, while growing as a population, should be considered a success. Sure, it isn’t a perfect proportional representation, but we should also consider what margin of error is acceptable. Do we seriously anticipate that each proportion will match exactly every year? That doesn’t seem realistic.
There is one more remark that should be taken into consideration, and then there is one very important disclaimer. This is the statement:
At two-year colleges, the share of minority students is notably higher than at four-year institutions.
In my reading of the piece, I interpreted this as a criticism of enrollment. However, enrolling in a community college instead of a four-year university due to its reduced tuition costs is frequently the best choice. Is it possible that students who identify as belonging to a minority group are making a savvy move?
The Caveat
A cursory check on Google reveals that more than one-third of college students are adults older than 25 years old. In their third figure, they make a comparison between all college students and the general population of those between the ages of 18 and 24. This raises a few questions for me. They are comparing fewer than two-thirds of the college population with the total population of 18–24-year-olds. We should control for differences in race and ethnicity by age, as I mentioned in my piece titled “U.S. Demographics by Age,” but here we aren't exactly comparing apples to apples. In the end, though, the arguments that I make against their remarks are valid.
Please Share
Share this post with your friends (or those who aren't friends of yours) and on social media to help get the word out about Briefed by Data. You may follow me on Twitter at @BriefedByData. Send me an email at briefedbydata@substack.com if you have any suggestions for articles, comments, or thoughts. Thanks. Cheers, Tom.
Data
The data is provided in the The Chronicle of Higher Education article, “How Diverse Are America’s Campuses?” Kudos to them for doing so.


