

Reality vs. perception in crime changes
National and NYC data

Is crime going up or going down? Well, it depends. It depends on what we mean by crime. It depends on where one lives. It depends on the starting date. If we can get all of this straight, we then need to consider how people perceive changes in crime.
Four graphs will try to help us understand crime and how it is perceived. The data comes from the Real-Time Crime Index. They use a sample of locations around the country and within states that are representative of the U.S. The advantage here is they update their data more often than the FBI. The disadvantage is we don’t get total crime counts, but we do get an accurate representation of changes in crime, and that is really what we want. Let’s go to the data.
We’ll start with U.S. homicides in Figure 1, but I don’t think this is the crime to focus on. We’ll get to that. The 12-month rolling mean shows that homicides have been going down; a drop from around 800 to 600 is a 25% drop in homicides. Clearly, homicides are decreasing. But…

How is this perceived? First, homicides are still higher than before 2020. Is that a proper comparison? I think there is an interesting issue here about how homides are compared to previous times. Homicides are going down, but it is still fair to consider them to be a problem if you compare them before 2020.
More subtle in our psychology may be the variation in crime. June is a peak month for homidices, and June 2024 was still pretty high. If we are inclined to think that crime, in this case very specifically homicides, is out of control, our confirmation bias will hang on the reporting in June.
It is accurate to report that homicides are decreasing nationally, yet it is still fair for people to see homicides as a problem.
Let’s now look at homicides in NYC, Figure 2. We see the same overall decline as in the national data, and again, using the rolling mean, it is about a 25% drop from the peak to the end of the rolling mean. But…
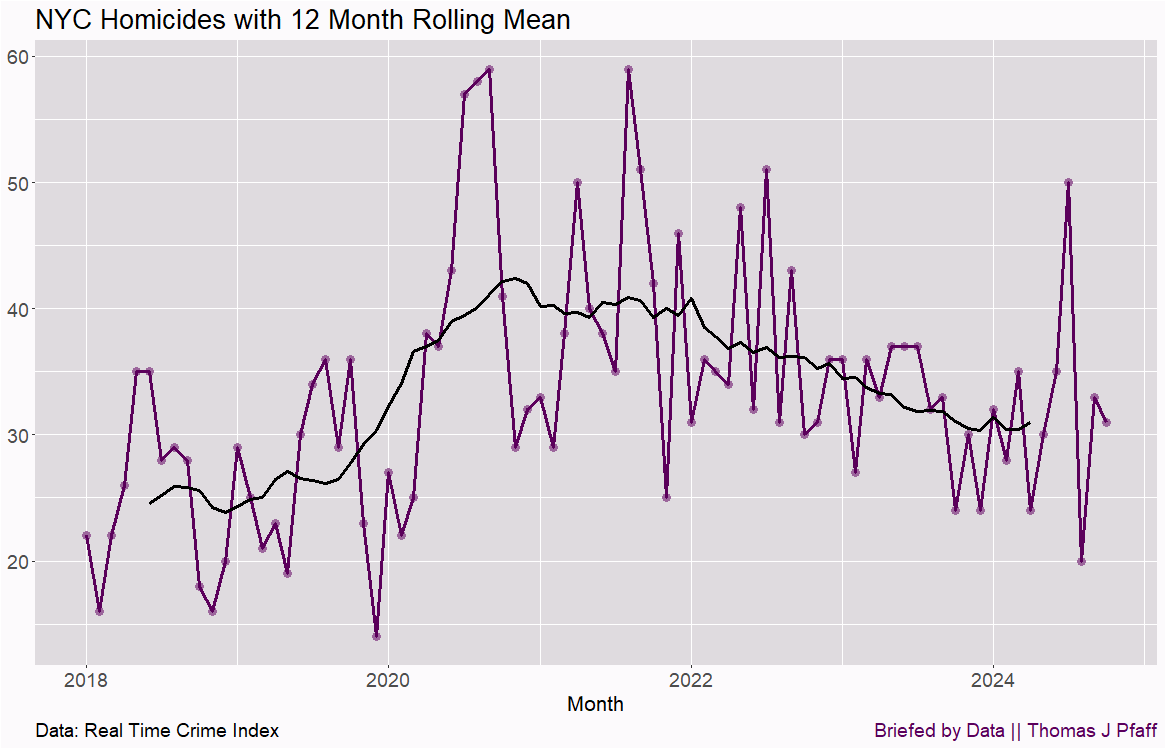
Look at the June 2024 peak. That’s enough to dampen any enthusiasm for overall declining homicide rates in NYC. At the same time, homicides are still a good bit above pre-2020 levels. Again, it is true to say that homicides in NYC are decreasing, yet the average person may not perceive the drop because of the variability and that it is still elevated.
I’m not sure homicides are the key to perceptions of crime. Homicides tend to be between people that know each other, and so beyond the news, they don’t impact that many people. I think the aggragate category of violent crimes (murder, rape, robbery, and aggravated assault) is a better indicator of crime.
Let’s start with the national violent crime data in Figure 3. The month-to-month variation is on the order of 25%, but the rolling mean shows that violent crime is going down and close to pe-2020 levels. All good, but what about NYC?

NYC isn’t doing as well as we see in Figure 4. In fact, overall violent crime is still going up in NYC. The media narrative has now become a problem. A national news outlet can report that U.S. violent crime is decreasing, and someone in NYC can lose complete confidence in the media because violent crime is not decreasing from their point of view.

Crime is a local issue, and the media needs to be very careful about reporting (good luck with that) national data as it may not reflect all localities. As people aren’t always careful with language, disagreements are easy to come by. Person A: Isn’t it great that violent crime is going? Person B: What is wrong with you? Violent crime is getting worse. These two could argue about this all night, and both can accurately cite data and not realize that A is referring to national data while B is referring to NYC.
So, is crime going up or going down? Nationally, homicides and violent crime are decreasing. On the other hand, violent crime is still on the rise in NYC. If you want to know about how a person perceives crime, you need to probably drill down to at least the city or county level and maybe the neighborhood level.
To me, there are two key questions about perceptions of crime. First, when a person is asked about crime going up or down, what guides their thinking? This may depend on where they live and whether or not they pay attention nationally or locally, as well as who their friends are. I can easily see two people living in the same city with two different answers to the questions on changes in crime, with both having reasonable responses. For example, one’s job may have them come into contact with more people impacted by crime or even see more crime than another person. Crime rates are, to some extent, personal.
The second, which I think would be great to study, is how much does crime have to go down or up for people to notice? A 5% change in crime probably doesn’t register. Is a 25% drop enough? Maybe, but this may depend on the size of the place one lives and, again, one’s day-to-day experiences. Formally, we should look at crime rates, but counts may matter more in perception. For example, a 1 per 100,000 violent crime rate in a big city allows for a lot of reporting on crime but very little in a town of 50,000.
I may have created more confusion than clarity. Let me know in the comments.
Please share and like
Sharing and liking posts attracts new readers and boosts algorithm performance. I appreciate everything you do to support Briefed by Data.
Comments
Please let me know if you believe I expressed something incorrectly or misinterpreted the data. I'd rather know the truth and understand the world than be correct. I welcome comments and disagreement. We should all be forced to express our opinions and change our minds, but we should also know how to respectfully disagree and move on. Send me article ideas, feedback, or other thoughts at briefedbydata@substack.com.
Bio
I am a tenured mathematics professor at Ithaca College (PhD Math: Stochastic Processes, MS Applied Statistics, MS Math, BS Math, BS Exercise Science), and I consider myself an accidental academic (opinions are my own). I'm a gardener, drummer, rower, runner, inline skater, 46er, and R user. I’ve written the textbooks “R for College Mathematics and Statistics” and “Applied Calculus with R.” I welcome any collaborations.
Another issue is that a minority of violent crimes are even reported to the authorities. According to the National Crime Victimization Survey, between 40% and 50% are reported to the authorities.
Even taking that into account, when I took a look at the FBI UCR statistics for a recent article (https://borncurious.blog/i/152677807/violent-crime-rates-are-at-or-near-all-time-highs-in-most-major-american-cities-false), I found they were less than the 40 to 50% of violent crimes reported via the National Crime Victimization Survey. Thus, it appears that the number of crimes processed by police agencies and reported via the UCR are even less than the number of crimes reported to police. (It's also suspicious that there is a surge in crimes processed through the UCR every December, which makes me think police agencies are catching up on their reporting at the end of the year.)
Thus, crime statistics record a fraction (crimes processed) of a fraction (crimes reported to authorities) of actual crime. Because of this, there is a big gap between perception of crime and crime statistics.
I'm not familiar with the Real-Time Crime Index. Perhaps it's better than the FBI's UCR?