


Seasonal Solar Electricity Generation
Seasonal differences may surprise you.

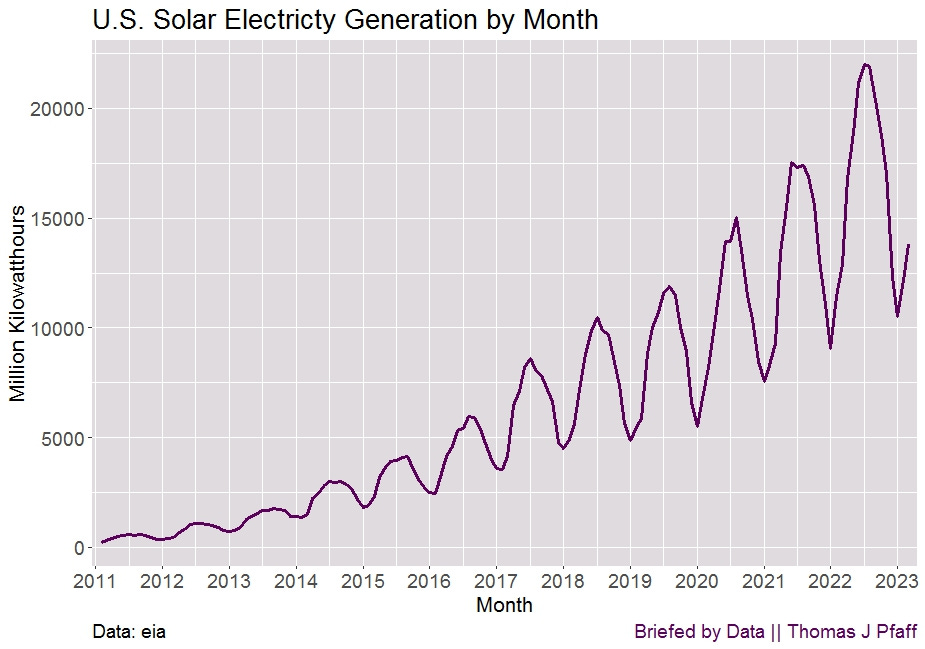
Naturally, there is more daylight in the summer than there is in the winter in the United States, which is something that is common knowledge, and this would have an effect on the amount of solar electricity generated. How big a gap is there between the two? The monthly solar energy generation in the United States is depicted in Figure 1. There is a discernible pattern in which there is greater generation in the summer and less generation in the winter, but the magnitude of those swings appears to be growing. One way to look at this is to determine the percentage drop that occurs from the month with the highest total to the month with the lowest total every year.
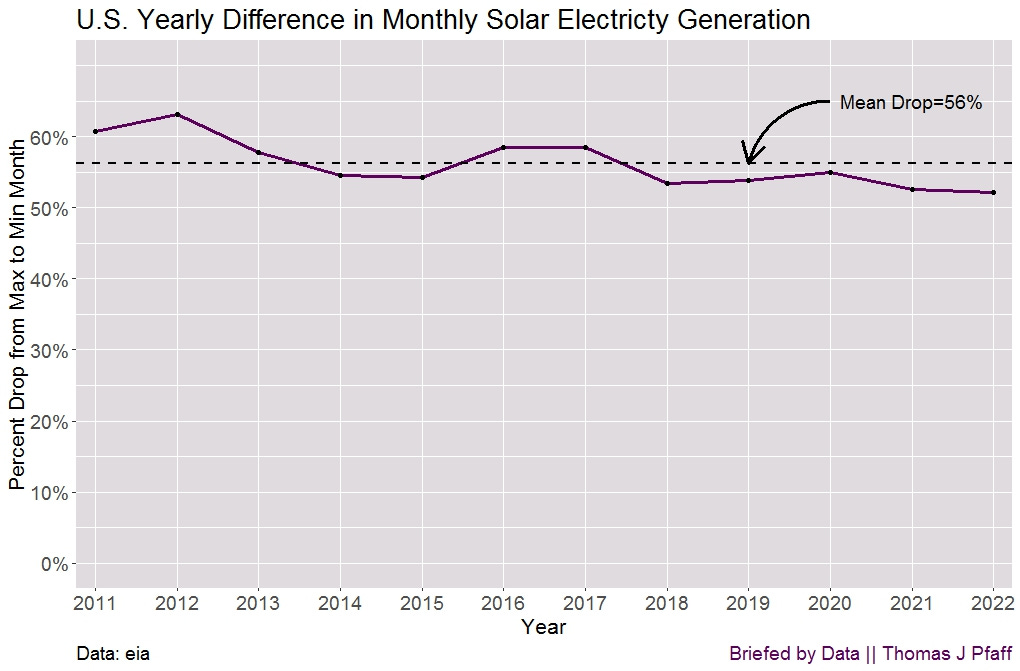
In Figure 2, we can see that the annual seasonal drop has averaged 56%, but it's possible that this number is inflated because 2011 and 2012 had higher values. Since 2018, the drop has been extremely stable, staying between 50% and 55% of the previous level.
This is not to imply that solar energy is in any way undesirable; rather, there are some difficulties associated with it. If we wanted to power the entire nation using solar energy, we would have to set up enough generation to make up for the loss that occurs during the winter.
The daily variation is also a challenge, as noted in the eia article As solar capacity grows, duck curves are getting deeper in California (June 21, 2023):
As more solar capacity has come online in California, grid operators at the California Independent System Operator (CAISO) have observed a drop in net load (or the demand remaining after subtracting variable renewable generation) in the middle of the day when solar generation tends to be highest. When graphed for a typical day, the pattern created by the midday dip in the net load curve, followed by a steep rise in the evenings when solar generation drops off, looks like the outline of a duck, so this pattern is often called a duck curve. As solar capacity in California continues to grow, the midday dip in net load is getting lower, presenting challenges for grid operators.
Our Finite World also points to challenges in solar as well as wind in the article Models Hide the Shortcomings of Wind and Solar:
One of the broader issues omitted is the fact that the electrical output of wind turbines and solar panels does not match up well with the timing needs of society, leading to the need for a great deal of energy storage. Another omitted issue is the huge quantity of energy products and other materials required to make a transition to a mostly electrical economy. It is easy to see that both omitted issues would add a huge amount of energy costs and other costs, if a major transition is made. Furthermore, wind and solar have gotten along so far using hidden subsidies from the fossil fuel energy system, including the subsidy of being allowed to go first on the electricity grid. EROEI calculations cannot evaluate the amount of this hidden subsidy.
The intention of this briefing is not to suggest that we should give up on solar energy; rather, it is to openly acknowledge the problems and work toward finding solutions to them. I am concerned that perhaps there is an excessive amount of optimism around solar.
Please Share
Share this post with your friends (or those who aren't friends of yours) and on social media to help get the word out about Briefed by Data. You may follow me on Twitter at BriefedByData. Send me an email at briefedbydata@substack.com if you have any suggestions for articles, comments, or thoughts. Thanks. Cheers, Tom.
Data
The eia Monthly Energy Review (June 2023) Table 10.6