


The Racial Wage Gap
A response to a NYT article

The New York Times published an article titled "The Racial Wage Gap Is Shrinking" yesterday. The story stated that although the difference is still quite large, it has decreased over the course of the previous five years. The article is misleading, but why? Because it didn't need to be.
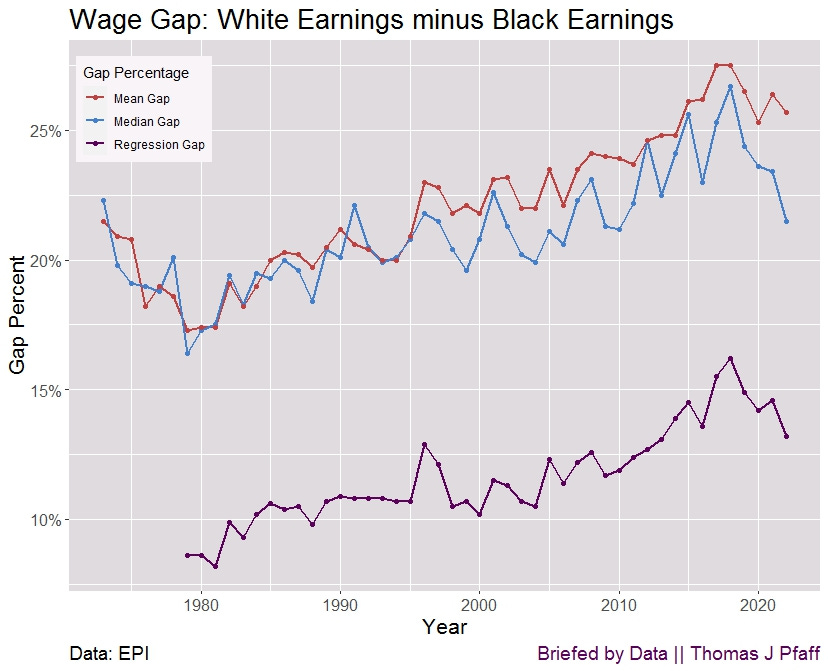
Let's begin with the graph that illustrates the percentage of the median wage earned by white people that is earned by the median Black person. The percentage of 79% that is highlighted in the graph for the year 2023 indicates that the median wage for black workers was 79% of the median wage for white workers. Everything about this is the same as the red line in Figure 1, with the exception that the gap is shown here. To put it another way, the 79% is shown as the 21%, which is the difference between the 79% and the 100%. When the gap is displayed, it indicates that closing it requires getting closer to 0%.
The article confused the two measurements in the third paragraph by saying
After all, even with the recent progress, the median Black worker makes 21 percent less than the median white worker.
This is not incorrect; it's just a bit confusing. The main issue is discovered in the last paragraph
According to the Economic Policy Institute, a typical Black worker last year made 13 percent less than a typical white worker who was the same age and gender, had the same amount of education and lived in the same region.
In other words, when you adjust for key variables (gender, race and ethnicity, education, age, and geographic location), the gap between the two groups is considerably smaller. I noted in the U.S. Demographics by Age post that age is one variable that has to be corrected for, and that is on the Economic Policy Institute (EPI) list.
To summarize, in order to provide an accurate representation of the gap, one must make adjustments to account for other variables. This is the line in Figure 1 that is dark purple. This adjustment was not concealed, and it is included in the same EPI data set as the one from which the New York Times obtained the median salary gap. It was a deliberate decision not to use it, and instead, they just mention it at the very end. The problem is that the adjusted data is, by far, the more accurate measurement of this gap. Maybe it didn’t work for the headline, as some might not see a 13% gap as enormous,” whereas 21% makes a better story.
Further, the adjusted line tells a different story. The median gap has been rising since about 1980. Interestingly, it dropped about 10 points from the early 1970s to 1980 and then began to rise. Has racism been increasing since 1980? The adjusted line data starts in 1980, is relatively flat from 1985 to 2010, and then begins to rise in 2018 before it starts back down again. This trend doesn’t work with the assertion:
The flip is also true. The racial wage gap widened in the 1980s, 1990s and early 2000s mostly because income inequality was soaring.
What significant events occurred close to the year 2010? Since we are already two years after the recession of 2008, it is quite unlikely that this is the explanation. Investigating this further would definitely be time well spent. In light of the aforementioned quotation, allow me to add one more point:
At Fortune 500 companies, for example, Black board members occupied less than 9 percent of all board seats in 2020, according to Deloitte. By last year, the number had risen to 12 percent (compared with 14 percent of the U.S. population). It remains unclear how widespread the changes in corporate America have been; corporate boards obviously make up a tiny share of jobs. But the recent emphasis on diversity has probably played at least a modest role in narrowing racial gaps.
Kudos to the New York Times for deciding to use the median gap rather than the mean gap. However, given that they have already done so, raising the compensation of those at the very top will not have any effect on the salaries of those in the middle. For example, in a group of three people making $1, $2, and $3, the median is $2. Increase the $3 to $1,000,000, and the median is still $2. The quote here really doesn’t relate to the median graph or the article.
The EPI took into account a number of characteristics in order to arrive at a pay difference that is more accurate; nonetheless, these variables may not necessarily cover everything. It's possible that the gap can be closed using other factors, such as selecting a different field of study in college (this is something I'll investigate in a later piece). It is also possible that it would make it worse. Understanding the pay disparity is essential, and a discrepancy of 13% is significant enough that it does not require being exaggerated with a simple statistic.
In the end, it can be hard to trust the NYT with articles like this. The single factor of race does not adequately explain the pay gap, which is typical of the majority of problems that may be seen in the world. There is more depth to the issue.
Please Share
Share this post with your friends (or those who aren't friends of yours) and on social media to help get the word out about Briefed by Data. You may follow me on Twitter at @BriefedByData. Thanks. Cheers, Tom.
Data
The Economic Policy Institute’s State of Working America Data Library Black-White wage gap.