U.S. Demographics, the "Cliff", and wages
A look at U.S. demography by age and race with some implications
My first post was U.S. Demographics by Age (6/1/2023), and I thought it was time to update that post with related implications. In particular, the “demographic cliff” that anyone in higher education has surely heard of is clearly in view. I’ll also add a connections to wages. Let’s go to the data.
The data in Figure 1 is 2023 population estimates from the U.S. Census Bureau. I’ve left out the American Indian and Alaska Native (AIAN) and Native Hawaiian and Other Pacific Islander (NHPI) since their populations are small and won’t be seen on the charts. The totals and percentages were calculated with those populations.

The data is a year old, which makes the 10-14 group now aged 11-15 and will begin graduating from high school in 3 years. That group is 6% smaller than the 15-19 group. If nothing else changes, colleges will be looking at 6% fewer incoming students, and the number of high school graduates continues to decrease after that. There are regional differences—another post perhaps—and reason why the percentage going to college may decrease while at the same time the number of high school graduates decreases. But we should start with all else equal; there will be fewer college students.
Hispanic, White or both?
I’ve separated the data into Hispanic and the other groups are non-Hispanic. For example, the White group is really the White non-Hispanic group. The same is true for the other groups. If you listen to the media, you would be led to believe that the White population will no longer be a majority in the future. If you look at the graph, you would also draw that conclusion. It is much more complicated than that. Hispanic is an ethnicity, and the vast majority of them consider themselves White, at least according to the Census Bureau. This is also worth a future post.
Median ages and wages
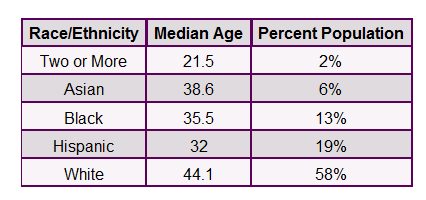
Figure 2 is the inset table from Figure 1. The median age of the White population is larger than all other populations. One ramification of this is that we would expect the median wage of the White population to be larger than the other populations. In fact, Asians make more, but we don’t hear about that, and we do hear about the White-Black wage gap.
For example, the EPI maintains data about the median wage of workers by race and ethnicity, which I’ve provided in Figure 3.

The median age difference between the White and Black populations is almost 9 years. Now, I’m sure economists and others will (rightfully, and I look forward to the comments, especially if you provide a quick way of adjusting for the median age differences) throw a fit here, but one way to get an idea of the impact of the age difference is to compare Black wages in 2023 ($20.11) with White wages 9 years ago ($23.71) as opposed to 2023 ($25.97). The idea is to try and match the median age of the populations by deaging the White population. The gap closes by a couple of dollars for this choice of 9 years. Obviously, the choice of 9 years matters, as there are years with real wage growth and those without any.
Now again, this is just to get an idea of the impact of the median age difference. Most groups make more money today than when they were 9 years younger. The point here is that anyone talking about the White-Black wage gap (or any wage gap between groups) without adjusting for the median age of the population as well as other differences such as geography and career choices isn’t being honest.
Compare to 2 years ago
Here is the graph from over a year ago, which is 2021 estimations. The shape is similar, but the drop-off in the younger ages is more evident in the 2023 data. The peak in the 30-39 group is larger in this year graph also.
Please share and like
Sharing and liking posts attracts new readers and boosts algorithm performance. Everything you do is appreciated.
Comments
Please point out if you think something was expressed wrongly or misinterpreted. I'd rather know the truth and understand the world than be correct. I welcome comments and disagreement. We should all be forced to express our opinions and change our minds, but we should also know how to respectfully disagree and move on. Send me article ideas, feedback, or other thoughts at briefedbydata@substack.com.
Bio
I am a tenured mathematics professor at Ithaca College (PhD Math: Stochastic Processes, MS Applied Statistics, MS Math, BS Math, BS Exercise Science), and I consider myself an accidental academic (opinions are my own). I'm a gardener, drummer, rower, runner, inline skater, 46er, and R user. I’ve written the textbooks R for College Mathematics and Statistics and Applied Calculus with R. I welcome any collaborations.


