


U.S. population declines by age
The demographic cliff is really a downhill slope for decades

If you live within higher education, you have heard of the demographic cliff. This cliff isn’t a one-year event, and it will impact more than just higher education. There will be a need for fewer K-12 teachers. Indeed, this will have an impact on any business that depends on younger consumers.
The Census Bureau recently updated their population estimates by age. Let’s go to the data and understand this “cliff.” Figure 1 shows the Census Bureau's estimates of population by age on July 1, 2024. Those who are 17 years old, highlighted in Figure 1, would have applied to college this past year, making them part of the 2025 entering class. This past admissions cycle was a slight improvement over last year.
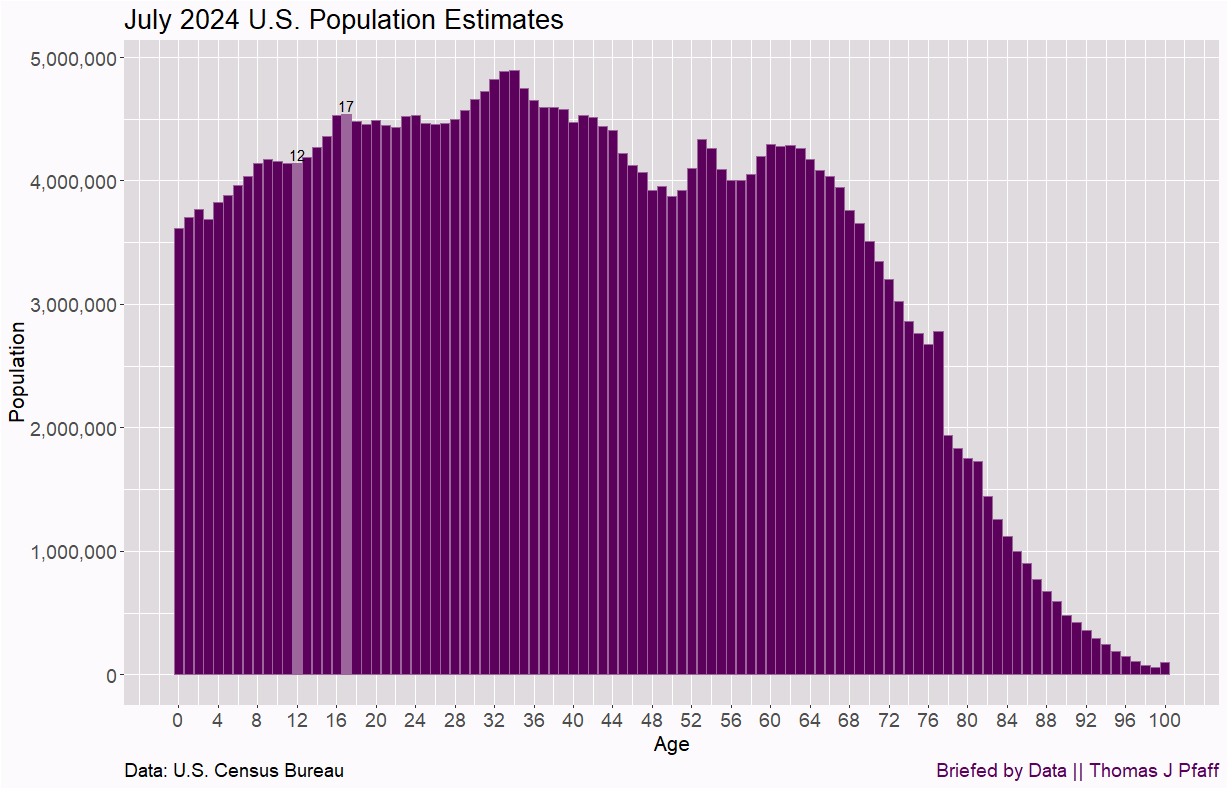
Age 12, also highlighted, is the pause for the first drop. From age 17 to age 12, there is an 8.7% drop in population. From age 17 to age 1, there is a 22.6% drop in population, with a pause from 12 to 9. These are national statistics, which have an impact on businesses that operate nationwide. However, the statistics for K-12 school districts hold greater significance. Either way, there is a decline in the number of kids in school, and there will be a need for fewer K-12 teachers as well as college professors.
For colleges, most of them are concerned with regional populations, and there are differences. In addition to the total number of high school graduates, predictions indicate a decrease in the percentage of students who are expected to attend college. Colleges are facing both a decrease in high school graduates for decades to come and a likely additional decrease in the percentage of students that will attend college.
To see the change from age to age, Figure 2 provides the percentage change from the older age to the next age younger. For example, at age 17, there is a 1.2% increase in population from age 18 to age 17. We are headed into a period where there are declines in population at each age group from 17 down to 1 in all but three instances, and this change has wide-ranging economic impacts.

One bonus bit of data. The Census Bureau data release included population estimates of age by sex. Quiz question: At what age do we switch from more females than males? Figure 3 has the answer.
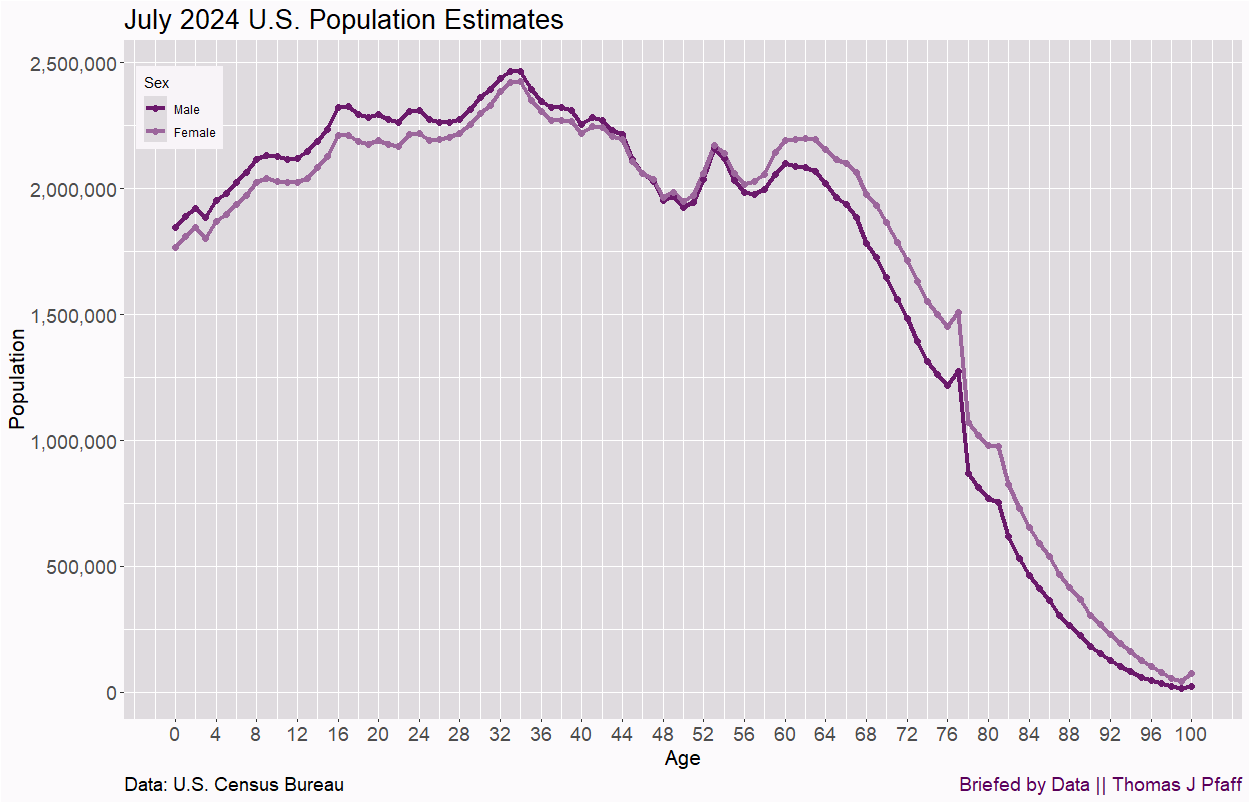
By age, there are more males than females until about age 46. Most people don’t realize that there are more male births than female births.
Please share and like
Sharing and liking posts attracts new readers and boosts algorithm performance. I appreciate everything you do to support Briefed by Data.
Comments
Please let me know if you believe I expressed something incorrectly or misinterpreted the data. I'd rather know the truth and understand the world than be correct. I welcome comments and disagreement. We should all be forced to express our opinions and change our minds, but we should also know how to respectfully disagree and move on. Please feel free to share article ideas, feedback, or any other thoughts at briefedbydata@substack.com.
Bio
I am a tenured mathematics professor at Ithaca College (PhD in Math: Stochastic Processes, MS in Applied Statistics, MS in Math, BS in Math, BS in Exercise Science), and I consider myself an accidental academic (opinions are my own). I'm a gardener, drummer, rower, runner, inline skater, 46er, and R user. I’ve written the textbooks “R for College Mathematics and Statistics” and “Applied Calculus with R.” I welcome any collaborations.