


Why is there a racial wealth gap?
A response to a Brookings article

I disagree with this summary from the Brooking article. Black wealth is increasing, but so is the racial wealth gap (1/9/2024)
These findings illustrate the systemic compounding of wealth, which exacerbates racial gaps. In other words, wealth begets wealth. Past and present discrimination in critical markets—including housing, banking, taxation, higher education, and more—result in lower average wealth for Black families. Policies that privilege whiteness are reflected in higher levels of wealth for the average white family, which can be leveraged across generations to generate greater wealth and advantages.
A short remark to point out that all four links in this quote lead to various Brookings papers. Perhaps a brief review of the literature is in order. Anyway, let's go to the data. The data come from the Federal Reserve's Survey of Consumer Finances (SCF). There is a link in the top right corner of the website.
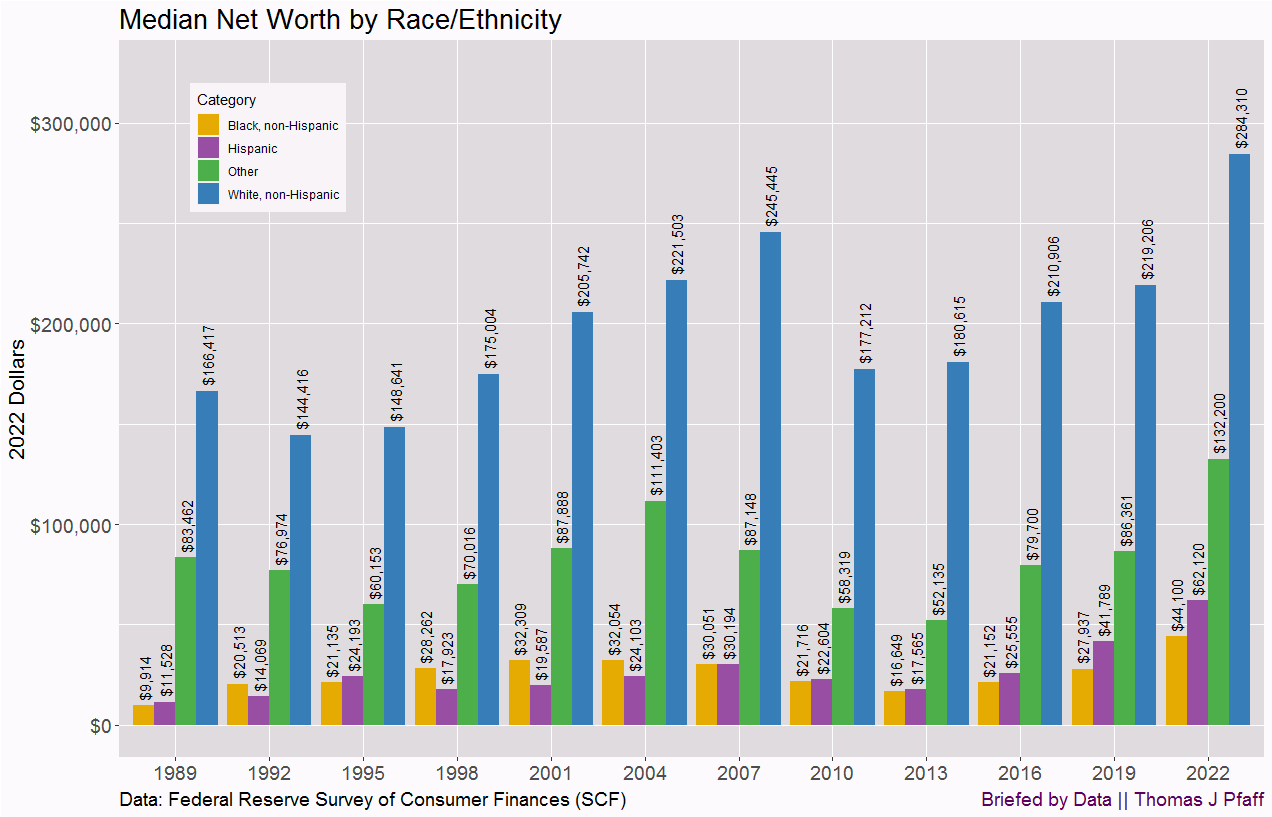
Brookings' presentation on the race gap is based on Figure 1. In 2022, the median White net worth was $284,310, while the median Black net worth was $44,100, representing a $240,210 disparity. A disparity like this, which has grown over the last three years, should obviously be investigated. Brookings conducts this analysis by examining where each group's wealth is held (e.g., home, stock equity) and how it has changed. Let's look at variables they overlooked to explain at least some of the difference, using the same data source they did.
Age
Figure 2 appeared in my essay, U.S. Demographics by Age, published on June 1, 2023. It is worth noting that the median White person (age 43.8) is approximately a decade older than the typical Black person (age 35.1). It's not difficult to believe that older people have more wealth, but how much?

Figure 3 (note you can click on the graph to make it bigger) depicts net wealth by age category. It is unsurprising that net worth increases with age. The only thing that has changed since 2010 is the 75 and older age group. They fluctuate between increasing and decreasing in comparison to the 65-74 age group. In 2022, the increases for the age groups less than 35 through 55-64 are $96,260, $111,400, and $117,570. In other words, the difference in median age may account for around $100,000 of the $240,210 gap. This assumes that Black net worth rises alongside the national median. Age explains some of the gap, but we shouldn’t assume the full $100,000. However, we should not compare the net worth of groups with varying median ages without correcting for age.

Family structure
Who has a higher net worth: a couple with children or an individual without children? Figure 4 contains your answer. A couple with children has a higher net worth than anyone else, save the couple without children. Why is this important when comparing the Black-White net worth gap?

Consider Figure 5 from the Pew article A record-high share of 40-year-olds in the U.S. have never been married (6/28/2023). The proportion of 40-year-old Black people who have never married is more than double that of White people and around 2.5 times that of Asians. This also explains some of the Black-White net worth disparity. The bottom line is that marriage and sharing expenses increase your net worth.

Figure 6 from the Census Bureau article Percentage and Number of Children Living With Two Parents Has Dropped Since 1968 (4/12/2021) discusses family structure. It's worth noting that only roughly 40% of Black children live with both parents. Meanwhile, this figure is 75.5% for White households and 87.4% for Asian ones.

To make a fair comparison of the Black-White net worth gap, you have to adjust for both age and family structure.
What about Asians?
At this point, you might be asking about Asian net worth. They marry more and have a much higher two-parent family structure. The Federal Reserve Survey of Consumer Finances (SCF) data does not have Asian net worth, but the Brookings article notes this:
However, according to the Survey for Consumer Finances, median Black wealth increased from $27,970 to $44,890, but continued to lag other racial groups. In 2022, median wealth was approximately $62,000 for non-white Latino or Hispanic households; $285,000 for white households; and $536,000 for Asian American households. (Asian American household wealth data was only provided for 2022, and therefore time series graphs will only show wealth data for the racial categories Black, Latino or Hispanic, white, and other, which includes Asian American, Native American, and Pacific Islander wealth.)
The White-Asian net-worth discrepancy is $251,000, which is greater than the Black-White gap of $240,210 (yep, the Black-Asian gap is nearly half a million dollars), while the median Asian person is 6 years younger than the median White person. Because this information wasn't present in the time series data that SCF provided, Brookings appeared content to ignore it. How does Brookings address this disparity in their statement that follows?
Policies that privilege whiteness are reflected in higher levels of wealth for the average white family, which can be leveraged across generations to generate greater wealth and advantages.
Do these policies that privilege whiteness work doubly for Asians? Further, the second half of this quote can also be questioned. The Federal Reserve of Boston article New study: Inheritances contribute only modestly to the wealth gap between white and Black families (3/27/2023) notes
Intergenerational transfers account for only 14% of the wealth disparity between white and Black families, according to the study.
Education
Figure 7 shows net worth by education status. Historically, finishing a college degree has been correlated with a higher net worth.

Figure 8 is from 2016, but comes from a reliable source, the National Center for Education Statistics. The point here is that 54% of Asians have at least a bachelor's degree. White people rank second at 35%, followed by Black people at 21%. Combining this data with Figure 7 explains some of the net-worth disparity once more.

Conclusions
Brookings is a well-known partisan think tank, but if they don't address any of the above in their piece, it's difficult to take them seriously, especially when they don't even include anything as basic as adjusting for median age. Can slavery, Jim Crow, and racism explain some of the Black-White wealth disparity? Sure, but there is evidence that it is only one source of the gap and likely explains only a small part of it. Asians serve as an excellent counterexample. They demonstrate how well a group can perform based on personal decisions (marriage, avoiding single-parent households, graduating from college, etc.). None of this appears in the Brookings article. If we aren't honest about analyzing the causes of this gap, then we won't arrive at appropriate policy. What is their solution?
In lieu of significant policy changes that impact wealth accumulation and distribution, racial inequality will likely continue to grow. Efforts to close this racial wealth gap include progressive tax policies in which the average tax burden increases with wealth and income, or reparations from the private and public sector. In tandem, both will act to ease immediate disparities and put us on a path of reconvergence so that racial wealth equity might be seen in our lifetime.
(Notice that the two links lead to other Brookings publications.) I'm not opposed to more progressive tax policies to increase services for the poor, but I don't see them as a strategy to effectively reduce the net worth disparity depending on how the money is used. For that matter, should anything be done to close the White-Asian net worth gap? I do not think so.
Finally, I'd like to know what Brookings believes wealth equity looks like. Should every group have the same net worth, regardless of their personal or collective choices? Perhaps they should engage in conversation and debate with others rather than remaining isolated in an echo chamber.
Please share and like
Please help me find readers by forwarding this article to your friends (and even those who aren't your friends), sharing this post on social media, and clicking like. If you're on Twitter, you can find me at BriefedByData. If you have any article ideas, feedback, or other views, please email me at briefedbydata@substack.com.
Thank you
In a crowded media market, it's hard to get people to read your work. I have a long way to go, and I want to say thank you to everyone who has helped me find and attract subscribers.
Disagreeing and using comments
I'd rather know the truth and understand the world than always be right. I'm not writing to upset or antagonize anyone on purpose, though I guess that could happen. I welcome dissent and disagreement in the comments. We all should be forced to articulate our viewpoints and change our minds when we need to, but we should also know that we can respectfully disagree and move on. So, if you think something said is wrong or misrepresented, then please share your viewpoint in the comments.
I wonder if Brookings is claiming differences in Black and non-Black median age, family structure, and education are attributable to current and prior discrimination. If so, then there isn't any disagreement between your more factored analysis and theirs.
Considering family structure when analyzing any wealth gap is absolutely essential. I appreciate the analyses and figures you presented in this post.
When looking at married couples, and the effect of sharing expenses on net worth, I am curious to know what kind of reverse causality, if any, may exist. Are those in better financial positions more likely to get married in the first place? What kind of effect do confounding variables like education and age have on single people’s decisions to enter a couple or marry?