Affirmative Action, SAT Scores, Asian Excellence and Harvard
What is fair and what won't change much
The decision of the Supreme Court to side with Students for Fair Admissions received a significant amount of coverage during the past week. One might wonder why a student of Asian descent would take offense to the impacts of affirmative action. As we continue to examine the statistics, we will notice that the SAT scores of Asian students are not merely a little bit better; rather, they are truly astonishingly better. We start by looking at the mean SAT scores by race and ethnicity (Figure 1). Here, we can see clearly that Asians have scores that are far higher than average, yet this does not in any way convey the whole story.
If you want to have a shot at getting into an elite college like Harvard, where the range of SAT scores for the top 25%–75% of applicants is 1480–1580, which indicates that 25% of applicants have SAT scores of 1590 or 1600, you need to have a score on the SAT that is higher than 1400. It was pointed out in Normal Density Tail Differences that even slight shifts in the mean of two normal distributions can have a significant impact on the tails, and being in the tail is required in order to gain admission to Harvard.
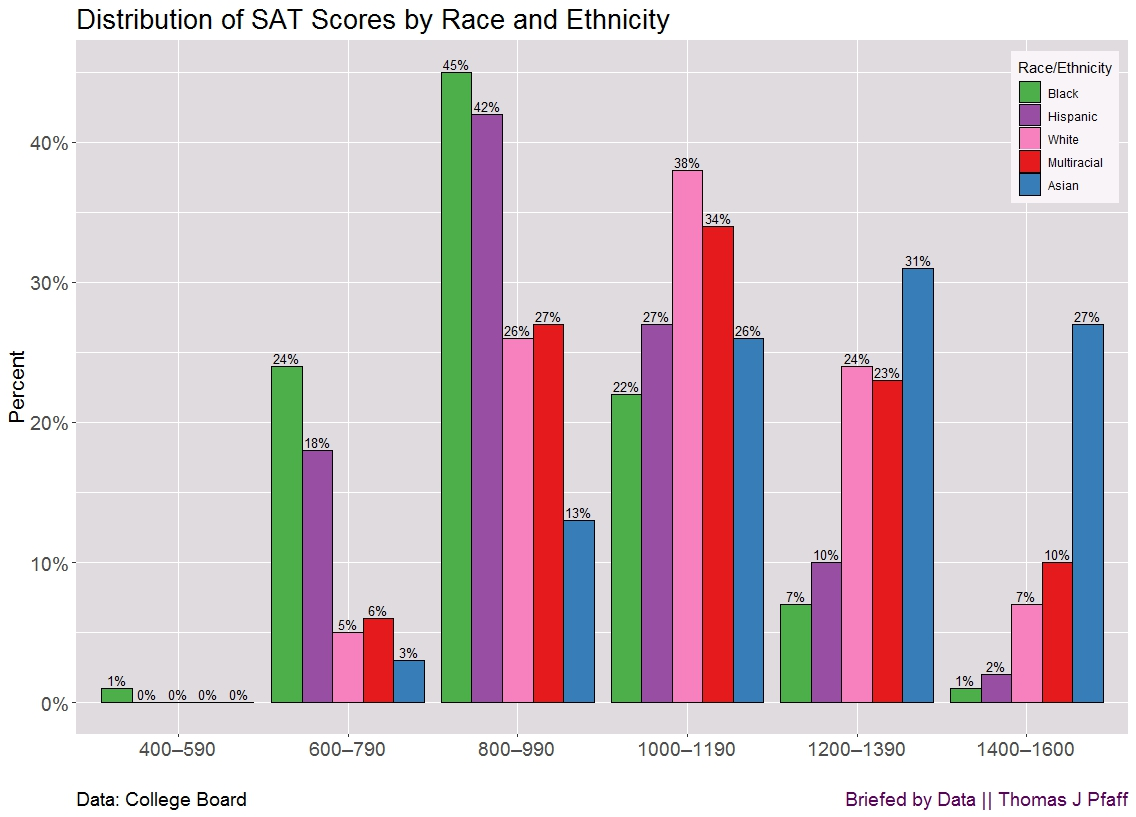
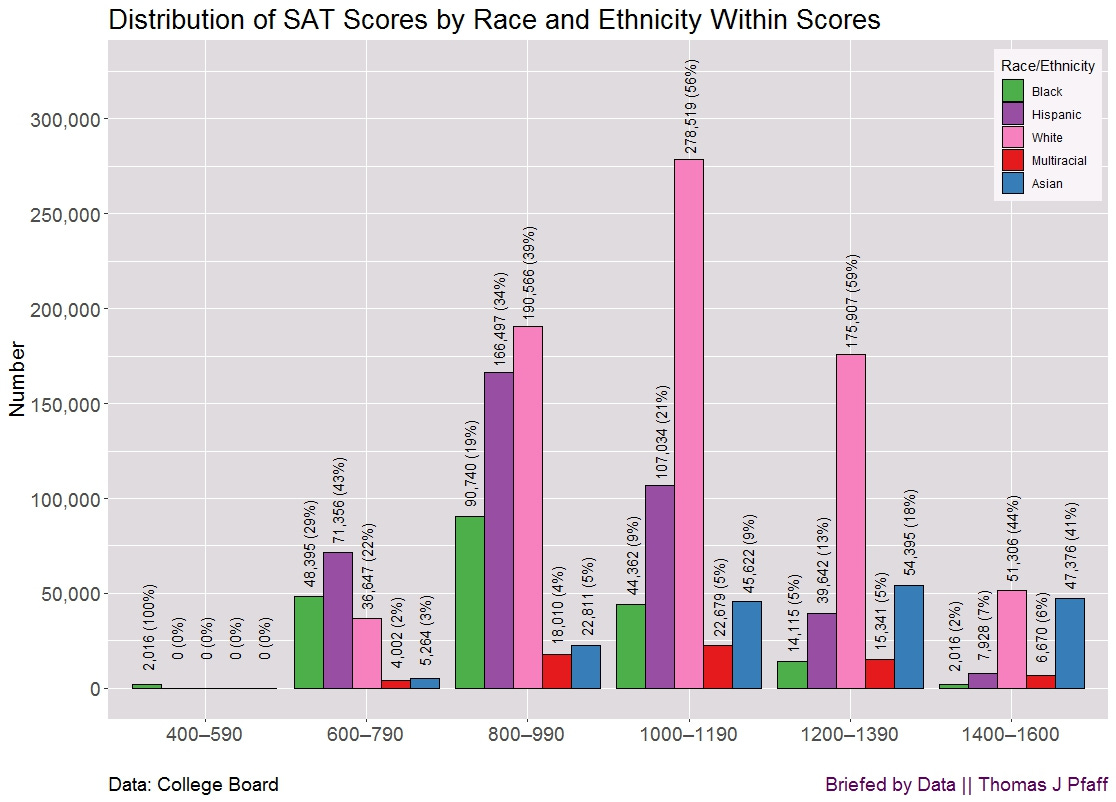
The College Board does publish a distribution of results by race and ethnicity, and that distribution is represented in Figure 2. Within that figure, we can see that 27% of Asians score in the range of 1400–1600. This is 2.7 times higher than students who are Multiracial, approximately 4 times more than students who are White, 13.5 times more than students who are Hispanic, and 27 times more than students who are Black. According to the findings of my article titled “U.S. Demographics by Race,” approximately 6% of college-age students are of Asian descent. Therefore, how does the performance of Asian students translate into the number of students who fall in the 1400–1600 range? Figure 3 answers this question.
Despite the fact that Asian students only make up about 6% of the college-age population and White students only make up about 53% of the college-age population, there are practically an equal number of them scoring in the 1400–1600 range. This is an absolutely astounding display of talent and hard work. If Harvard and other prestigious colleges accepted applicants based on their SAT scores, the student body would be composed of 44% White students, 41% Asian students, 7% Hispanic students, 6% multiracial students, and 2% black students. According to AdmissionSight, we find:
Based on the Harvard diversity statistics, 39.7 percent of Harvard University’s enrolled student population is white, 13.7 percent of the population is Asian, 9.46 percent of the population is Hispanic or Latino, 6.56 percent of the population is black or African American, 3.94 percent of the population identifies as having more than one race, 0.197 percent of the population is American Indian or Alaska Native, and 0.118 percent of the population is Native Hawaiian or Other Pacific Islanders.
If you read this carefully, you'll notice that the percentages don't add up to 100 percent. It turns out that twenty percent of Harvard's student body is comprised of students from other countries. If we take into account only students from the United States, we find that 52% of Harvard's undergraduates are White, 18% are Asian, 12% are Hispanic, 8.5% are Black, 5% are Multiracial, and 4% do not identify their race. According to the results of the SAT, the representation of Asian students is significantly lower than half of what we would predict. I can see why they would consider this to be unjust and why they would want to file a lawsuit over it.
It's also important to highlight the fact that these scores weren't the result of random chance. According to a study that was published in 2022 under the title Racial and Ethnic Differences in Homework Time among U.S. Teens, the average amount of daily homework completed by Asian students is 134 minutes, which is significantly higher than the average of 56 minutes completed by White students, 50 minutes completed by Hispanic students, and 37 minutes completed by Black students. In addition to that, they participated in additional educational activities for a total of 27 minutes, which is just about twice as much as the following group did.
What will change?
It isn’t clear that Harvard and other elite schools are going to change much, if at all. They are intelligent individuals who are going to proceed with their holistic admissions process. It is difficult to see past the fact that this is unfair. The general enrollment in higher education is on the decline, and educational institutions are looking for students to enroll. Any student who is even somewhat suitable will have the opportunity to attend college, and according to the Chronicle, as I explained in my article titled “Race and Ethnicity in 18–24 College Enrollment,” White students are slightly underrepresented in college enrollment, and this is not going to change very much in the near future. This is due, in part, to the fact that being admitted to a school and being offered a sufficient amount of financial aid so that you may go are two entirely separate processes. The ruling made by the Supreme Court was about admissions, not financial aid packages.
Please Share
Share this post with your friends (or those who aren't friends of yours) and on social media to help get the word out about Briefed by Data. You may follow me on Twitter at BriefedByData. Send me an email at briefedbydata@substack.com if you have any suggestions for articles, comments, or thoughts. Thanks. Cheers, Tom.
Data
College Board Data: https://reports.collegeboard.org/media/pdf/2022-total-group-sat-suite-of-assessments-annual-report.pdf


Thank you for compiling this data. Very useful for an article I'm writing