Classroom connections are less something you can apply right away and more of me pointing out resources. I believe that there is a lot of amazing math, statistics, and data out there that might be used in math classrooms and is also interesting to the curious. At the same time, the next time someone asks what math is used for, well, here are a bunch of examples.
Some of these examples may require some effort to be classroom-ready, and some of this has appeared in previous posts. I’m ordering this roughly based on the level of math. Please let me know if you or someone you know uses any of this in the classroom or has a relevant idea (email me at thomas.pfaff@sustainabilitymath.org). Really, leave a comment or send me an email if these classroom connection posts are useful. Similarly, if you have an opinion or concept that is relevant, please share it in the comments. Please share, like, subscribe, and feel free to comment.
Intro stats, 2 sample t-test, scatter plot, and more
In my post, Does more renewable electricity reduce prices? (8/20/2024) I gather data by state for the cost of electricity, type of electricity generated, and the political status of the state. Here is a link to an Excel file for that data. Note I can’t store it on Substack, so I put it on my sustainabilitymath.org site if you are curious about the URL.
You can reproduce the scatter plots in the post and you can do two sample test that would go with the graph below. Tests can be done by electricity type, total electricity generated, or percentage of electricity by source.
Related statistics, p-values, graphs
The paper Injuries With Electric vs. Conventional Scooters and Bicycles (7/23/202) is full of p-values, confidence intervals, and statistics that student’s might relate to. There is a link to the data, and some of this might be reproduceable. Here is the key table from the paper.
Interpreting confidence intervals and charts
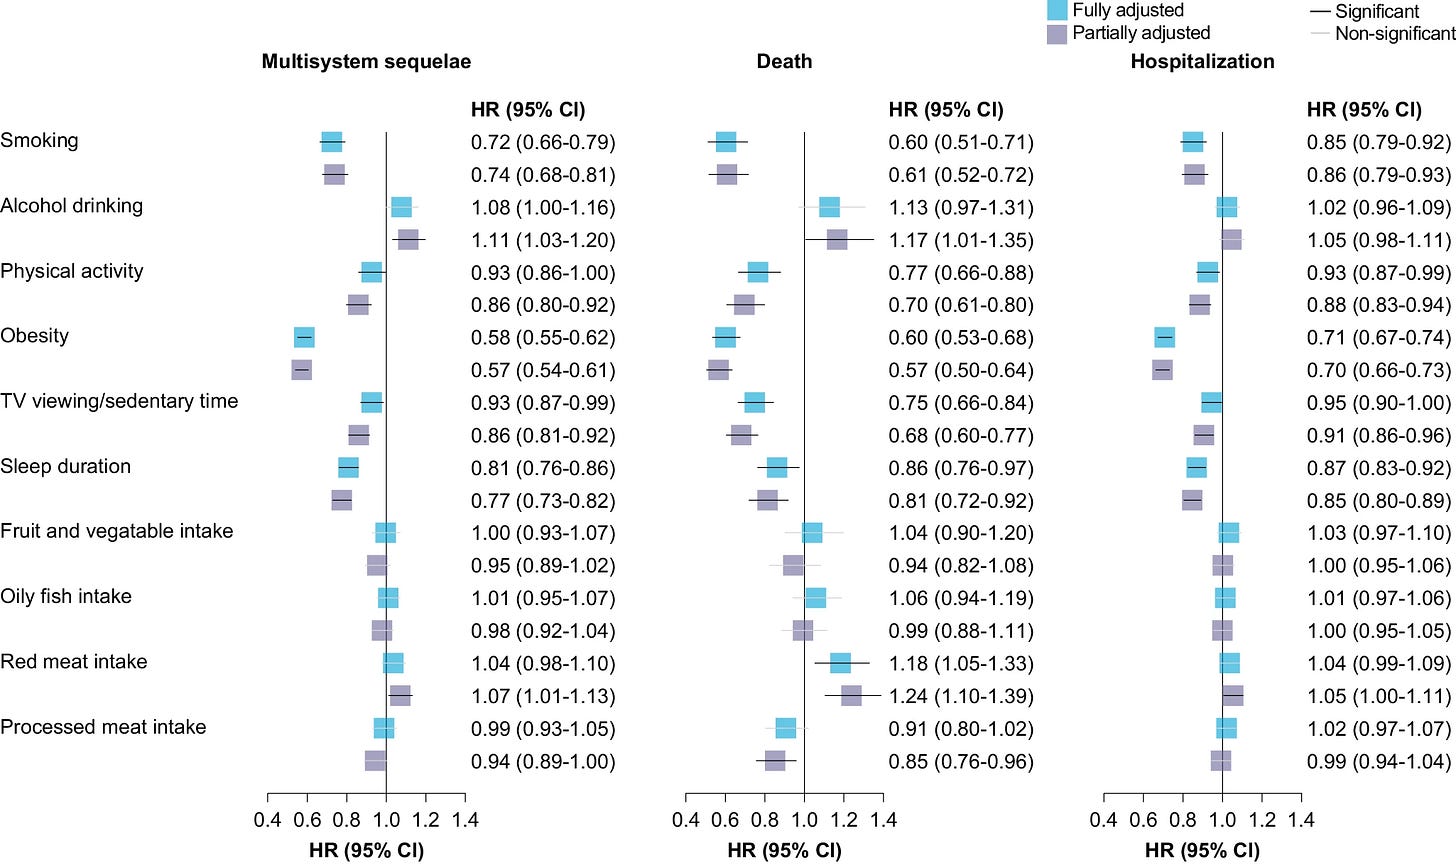
I referenced the paper Modifiable lifestyle factors and the risk of post-COVID-19 multisystem sequelae, hospitalization, and death (7/29/2024) in the Aug 15, 2024 QTRS. The graph here could be discussed or used as an assignment. In the paper, table 2 lists these confidence intervals, and students could be asked to interpret them.
ANOVA and box plots
The paper A highly resolved nuclear phylogeny uncovers strong phylogenetic conservatism and correlated evolution of fruit color and size in Solanum L. (5/27/2024), which I referenced in the July 18 QTRS, has this great graph.
The paper suggests that it has the data, but it seems like raw data, and it may take some work to get the data for this graph. On the other hand, maybe the data could be collected as a class project.
A two-variable function
Sometimes you simply want an interesting two-variable function, and Multi-dimensionality in plant root traits: progress and challenges (Aug 2024) has one for you. Note that RTD is root dry mass per unit root volume, RN is root nitrogen content, and SRL is specific root length or root length per unit root dry mass.
K means
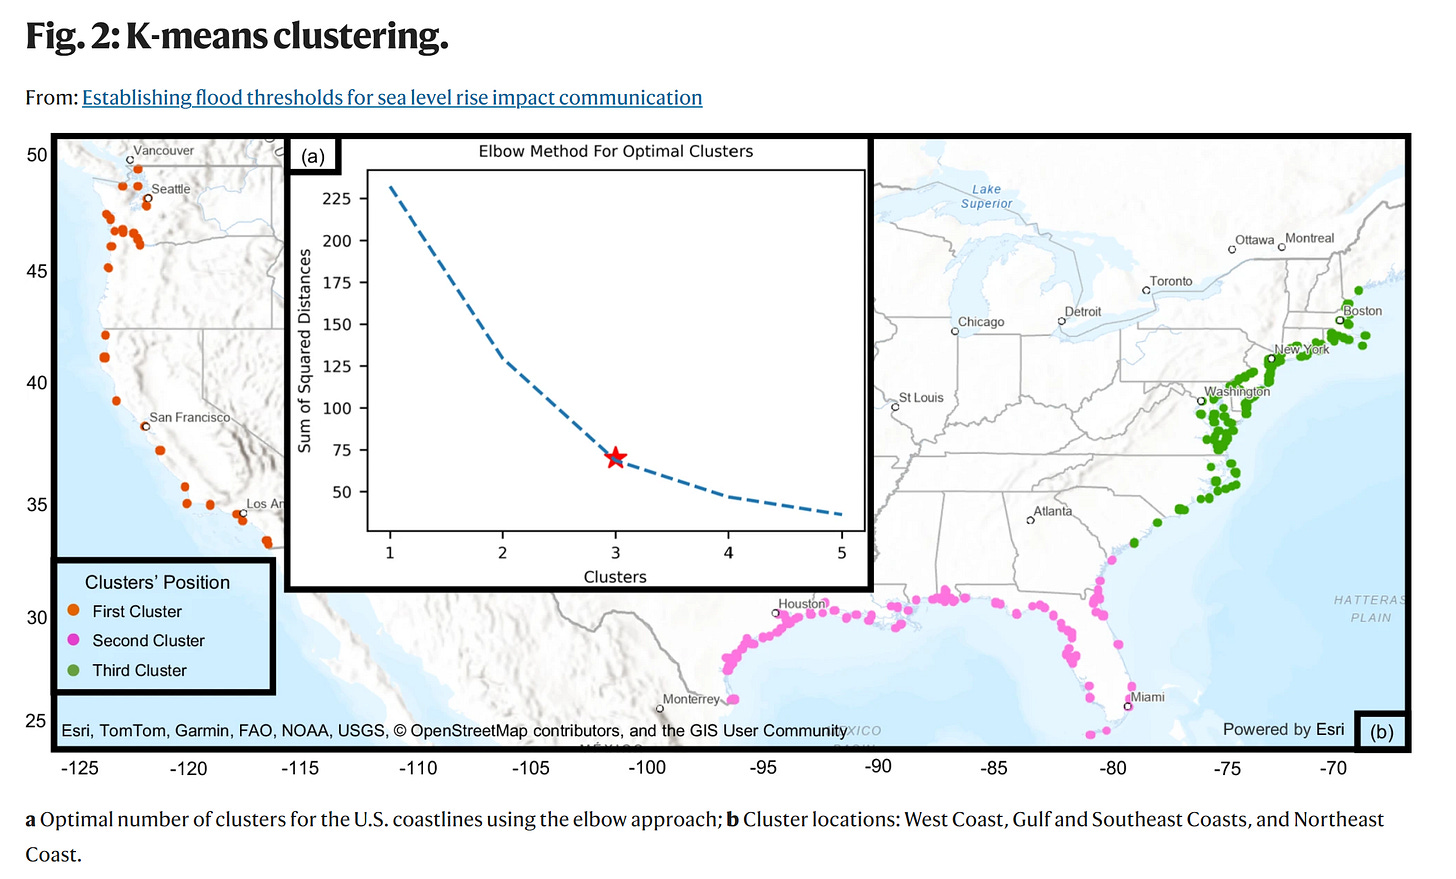
For an example of a K-means application, which includes the data and some nice graphs, see Establishing flood thresholds for sea level rise impact communication (5/18/2024). Here are two graphs from the paper.
As a bonus, they have a related interactive map related to the paper here: https://shorturl.at/cptP1
Please share and like
Sharing and liking posts attracts new readers and boosts algorithm performance. Everything you do is appreciated.
Comments
Please point out if you think something was expressed wrongly or misinterpreted. I'd rather know the truth and understand the world than be correct. I welcome comments and disagreement. We should all be forced to express our opinions and change our minds, but we should also know how to respectfully disagree and move on. Send me article ideas, feedback, or other thoughts at briefedbydata@substack.com.
Bio
I am a tenured mathematics professor at Ithaca College (PhD Math: Stochastic Processes, MS Applied Statistics, MS Math, BS Math, BS Exercise Science), and I consider myself an accidental academic (opinions are my own). I'm a gardener, drummer, rower, runner, inline skater, 46er, and R user. I’ve written the textbooks R for College Mathematics and Statistics and Applied Calculus with R. I welcome any collaborations.


