

Enrollment Changes in 12th Grade by State
A cool map graphic
Holiday request: It would certainly be nice to add a few paid subscribers this holiday season, but if that isn’t in your budget or interest, then please help spread the word about Briefed by Data. Sharing posts and encouraging friends to subscribe and repost on the Substack app or in notes makes a real difference. 100 new free paid subscribers is the goal from now until the end of December. I thank you in advance.
I’ve talked about declining fertility and school enrollment. Most recently in Public School Enrollment (11/18/2025), but only provided graphs by U.S. region. Today we’ll look at 12th grade enrollment by state with data from the Western Interstate Commission for Higher Education. Let’s go to the data.
Figure 1 (note you can click on the graph to make it larger) starts us off with the percentage change of 12th grade enrollment relative to 2009. The data are actual counts through 2023 with projections starting in 2024. In the case projections are good, as we can project 18 years out based on births. Variation is largely small and due to state migration and immigration. Note that a couple of states, DC in particular, go off the scale. If I used a scale to accommodate CD, the other states would be harder to read.
For example, we see that in NY the number of 12th-grade students was relatively flat until around 2025 but then consistently falls after that to 25% fewer 12th graders by 2040. In the north/northeast we see consistent declines in students in VT, NH, ME, PA, and RI, with a few states remaining stable: CT and NJ.
On the other hand, TX has seen large growth in 12th-grade students from 2009 to 2025 and little projected growth. Meanwhile, CA looks a lot like NY. Figure 1 is nice because we can see what has happened historically, but maybe we want to focus more on the future.
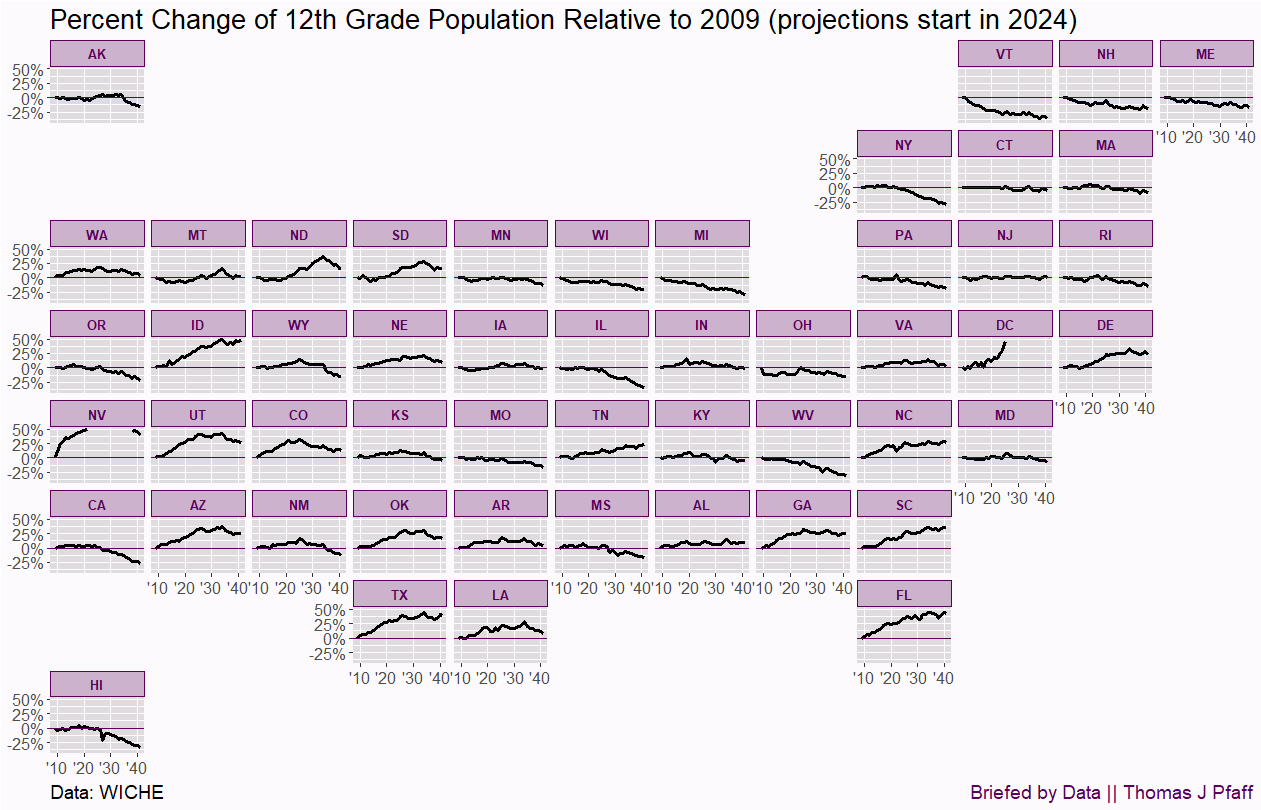
Figure 2 is the same as Figure 1, except it is a percentage change relative to 2023. California is projected to have 30% fewer 12th graders from now until 2041, while Hawaii is expected to experience a 40% decrease, wow. NY is going to lose about 25% of the 12th-grade population by 2040. These are dramatic changes in young people.
Percentage change is nice for comparing states, but it misses the importance of states like NY and CA, whose populations are much larger than others.

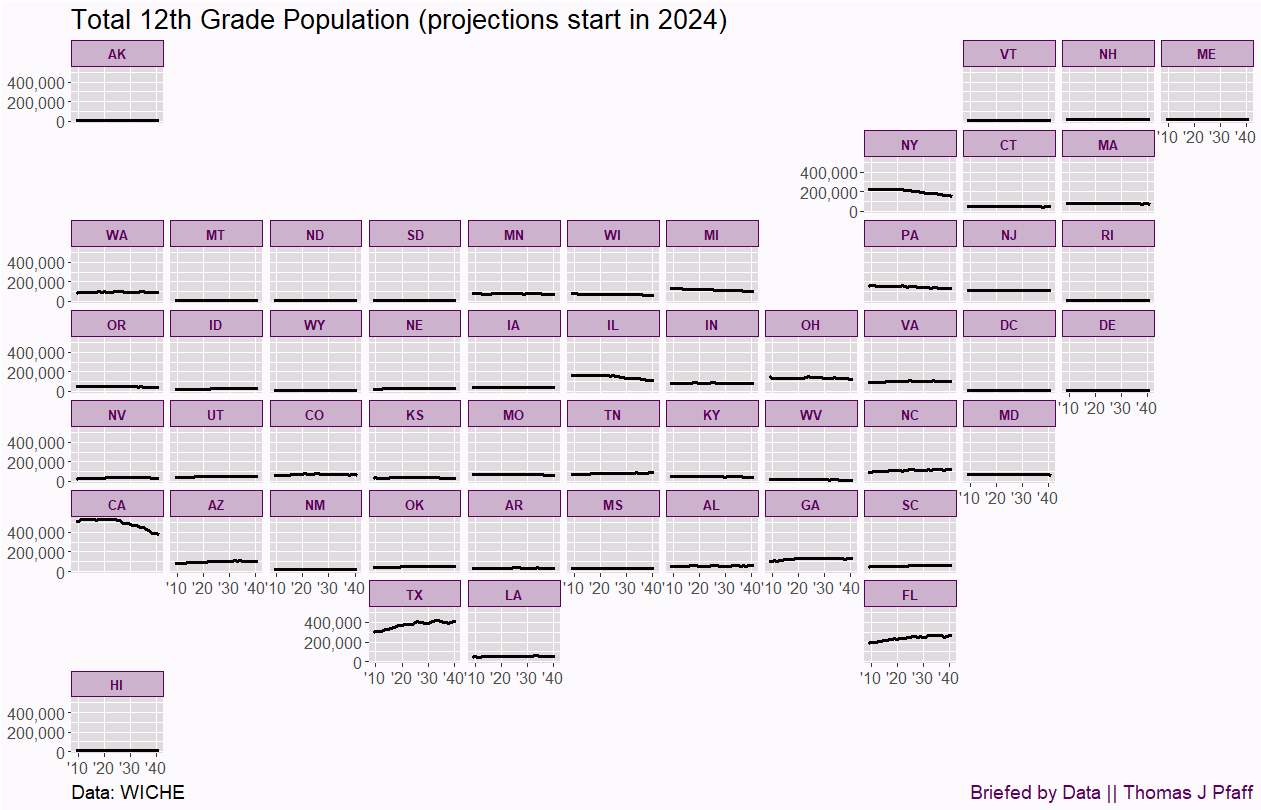
To complete the story, we have Figure 3, which shows the total number of 12th-grade students by state. The y-axis scale here is a bit of an issue because it looks like many states have zero 12th-grade students. The problem is we need a y-axis large enough to accommodate CA’s 500,000 students. The value of Figure 3 is that we see how much more influence CA, TX, NY, and FL have on the overall demographic issues, but the slight gains in TX and FL won’t make up for the losses in CA and NY.
Why does all of this matter? Higher education receives the most attention. Colleges in the north and northeast, as well as CA, are in trouble, but nearby states are going to feel the pressure as states with declining student populations compete for out-of-state students. Of course, this is only the number of possible graduates; you still have to convince them to go to college, which adds to the issues higher education is facing.
But higher education isn’t the only area where this matters. If you are managing K-12 systems in states like California and New York, you should consider reducing the number of teachers now to avoid having to fire them later. It's better to reduce the number of teachers now through attrition, which will lead to larger class sizes at first and then gradually decrease class sizes later.
Younger people are also significant consumers beyond their role in education. Reduced young people's consumption of goods and services will be lower. Then there is the issue of a decreased tax base and contributions to social security to support retirees.
Finally, all of this should influence immigration policy. As a country, we don’t want a zero-immigration policy because immigrants help backfill our declining population. At the same time, limiting immigration to some extent may be wise. Policy here should be very thoughtful.
Ultimately, the demographic cliff, as it is referred to, appears to concentrate too heavily on higher education while neglecting other societal aspects that will be affected by decreasing fertility and a smaller youth population.
Please share and like
Sharing and liking posts attracts new readers and boosts algorithm performance. I appreciate everything you do to support Briefed by Data.
Comments
Please tell me if you believe I expressed something incorrectly or misinterpreted the data. I'd rather know the truth and understand the world than be correct. I welcome comments and disagreement. I encourage you to share article ideas, feedback, or any other thoughts at briefedbydata@substack.com.
Bio
I am a tenured mathematics professor at Ithaca College (PhD in Math: Stochastic Processes, MS in Applied Statistics, MS in Math, BS in Math, BS in Exercise Science), and I consider myself an accidental academic (opinions are my own). I'm a gardener, drummer, rower, runner, inline skater, 46er, and R user. I’ve written the textbooks “R for College Mathematics and Statistics” and “Applied Calculus with R.” I welcome any collaborations, and I’m open to job offers (a full vita is available on my faculty page).
Good to see this data, especially as an infographic displayed over the US map.
It's not clear if this is total population or just public schools. Can you confirm it's not just public school population?
If public schools maintain funding, these population trends could improve student:teacher ratios, as you reported on in the linked article. I'm just trying to be an optimist. I'm sure someone will call for lower property taxes after they see student enrollment drop.
Your link from immigration policy to declining public school enrollment is weak.
I've worked with many green card and visa holders in the US. Some started families in the US, but not everyone wanted to start a family here. Many stayed single and sent money back to their family in their home country. The idea that Americans have smaller families and immigrants have large families could be a stereotype. There needs to be data on it to make your case.
And is there evidence that immigrants almost always enroll their children in public schools?
Interestingly, I found immigrant parents sent their children off to private schools/academies. Immigrant coworkers wanted the best education for their children. And many public schools are not the best ... because of many reasons. So I think an argument about immigrant families filling in the tax base and schools is weak.
I suspect many immigrant parents support voucher programs at a minimum, if not fully private options. Voucher support is a complex issue, involving teachers unions, etc. My suspicion is based on many immigrant parents who I've talked that are culturally conservative, and don't like the general liberal trend in public schools.