

Public School Enrollment
Decrease enrollment, increase costs, and a response to the New York Post
The New York Post has an article, ‘Bleeding kids:’ NYC public schools face biggest enrollment drop in four years (11/8/2025), about NYC public school enrollment drops.
New York City public schools shed another 22,000 students this year, with enrollment plunging 2.4%, the steepest decline in four years, according to preliminary Department of Education data — and experts say this trend will only get worse under incoming Mayor-elect Zohran Mamdani.
The startling new numbers follow a post-Covid trend that has seen families hit the exits over the past five years, adding up to a 12.2% decline.
I’ll ignore the “experts say” comment because there is nothing worse than unnamed experts. There are also reasonable complaints about test scores in the article, but what got me curious here is that before reading this article, if you asked me if NYC was losing public school enrollment, I’d say yes. Why? Because fertility rates have been declining in the U.S. See my post U.S. Demographics, the “Cliff”, and wages (9/3/2024) to see the decline in population by ages. The only thing close to a nod to declining birth rates in the article is in this one sentence:
New York City’s population shrank by 300,000 from April 2020 to July 2024 according to census data, and Chu says education spurred people to leave the city.
But even this paragraph is incomplete, as you could gain adults and lose children with a net loss of 300,000, for example. Can we explain some or part of the 12.2% decline that has nothing to do with NYC school quality? Let’s analyze data from the National Center for Education Statistics (NCES), and I will conclude by discussing how declining enrollment leads to cost inefficiency. Let’s go to the data.
We’ll start with Figure 1, providing public school enrollment for all grades by region. NCES doesn’t have city data, and all states would make for a cluttered graph. We do see a COVID drop in all regions, and only the South has recovered. We also see that the Northeast and the Midwest have been losing enrollment since 2000. An intriguing feature of Figure 1 is the growth in public school enrollment in the South. This presents us general trends, but the y-axis scale is so large it is difficult to obtain a sense of percentage change.
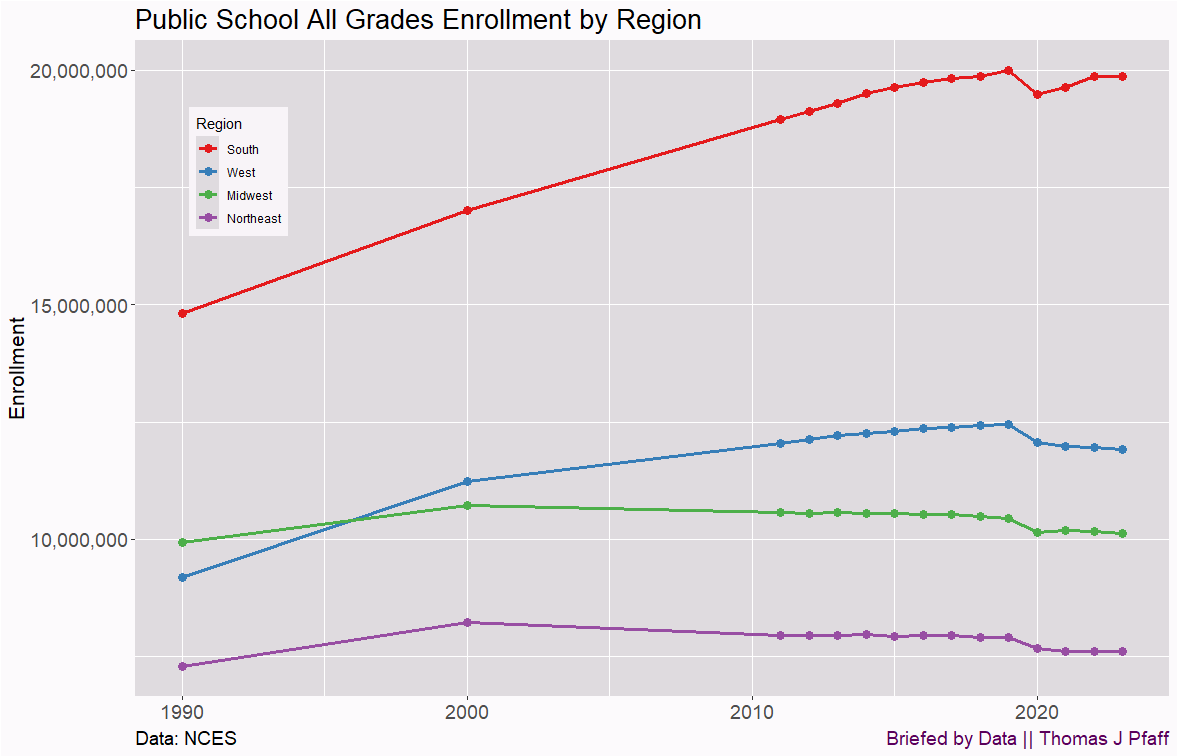
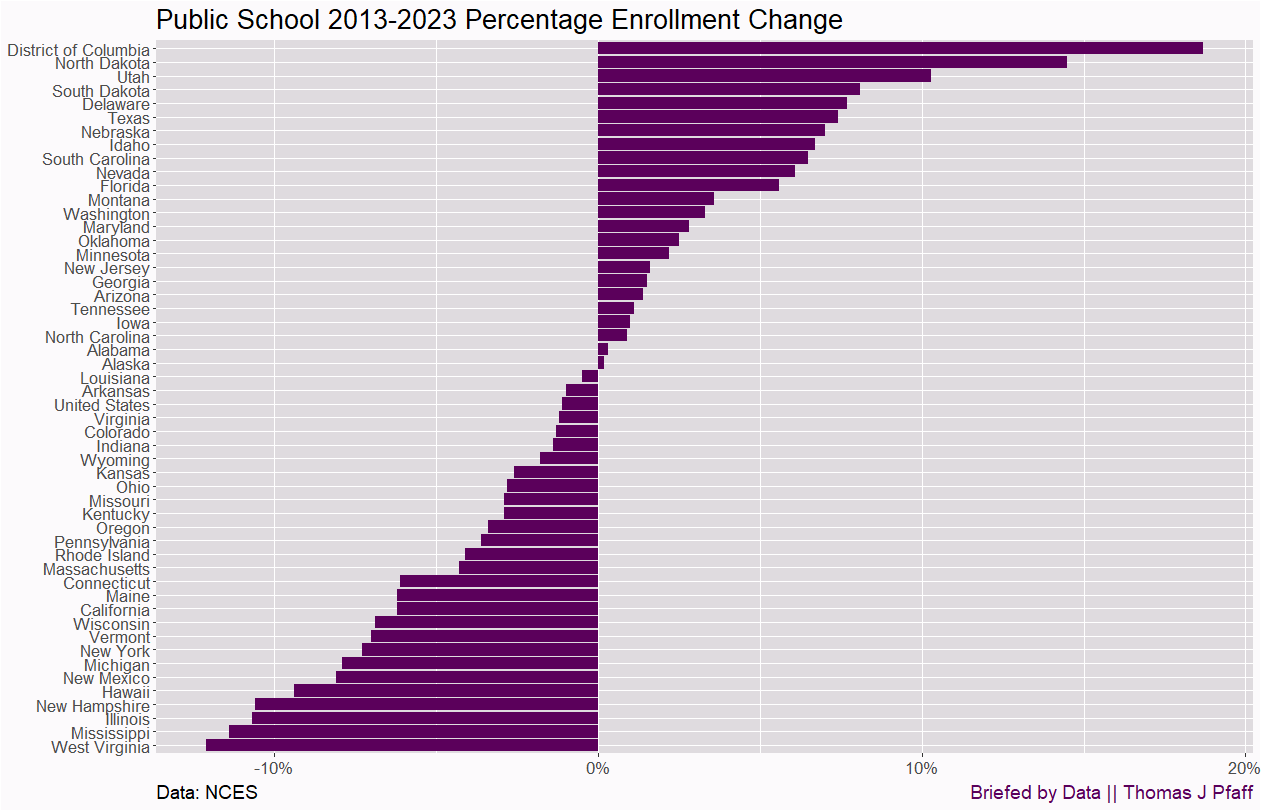
Figure 2 shows the percentage change in enrollment from 2013 to 2023 per state. NY has lost about 8% over that time. This data is not from the same time period as the Post article, but it does make it clear that NY State as a whole has been losing public school enrollment. It doesn’t speak directly to NYC, but it is close enough. To write an article about declining public school enrollment without talking about drops in fertility and comparisons to other states is simply misleading. How much of the 12.2% drop is fertility? I’m not sure yet, but certainly half. COVID also had some percentage of families decide to leave cities. Then, yes, poor test scores may have some impact, but statement like this one,
“You’re seeing families moving out to Long Island to buy their way into a better school,” Chu said.
don’t hold up, as New York State has seen declining public school enrollment, and it doesn’t matter which school a child attends in NYS.
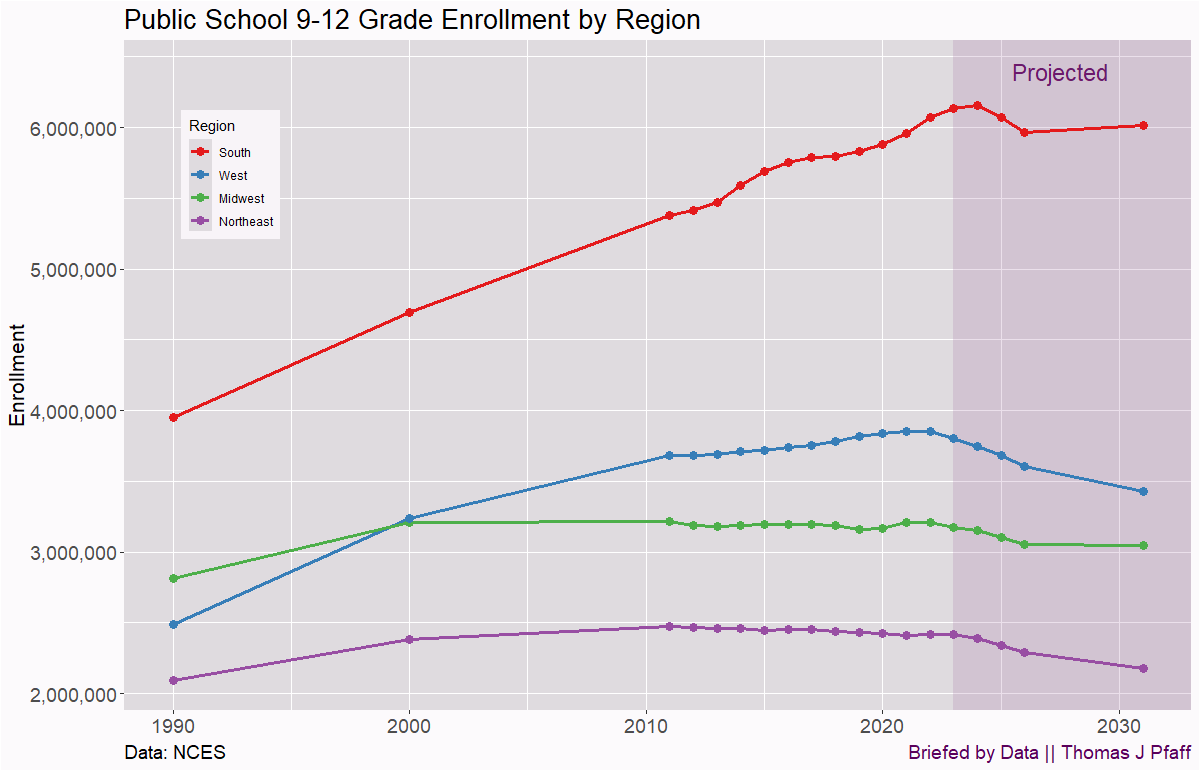
As I was working with NCES data, I realized they had 9-12 counts with future projections. Low fertility rates take time to impact grades 9–12, and we see that in Figure 3. For example, total enrollment in the Northeast began to decline around 2000, but 9–12 enrollment did not start to decline until after 2010. Again, we would expect NYC enrollment to go down. More startling, if you didn’t know about the demographic cliff, are the future declines in 9-12 students in the Northeast and West.
There is a table at the end that gives the 9-12 percentage change from 2017 to 2022 and the projected change from 2022 to 2031 by state. The columns are sortable by clicking on the column name. For NYS, there has been a 6% decline from 2017 to 2022 in grades 9–12, with a projected decline of 18%. NYS tops the list in both categories. I’d hate to be a college that primarily recruits from NYS.
The post article misses a good half of the enrollment decline by simply ignoring demographics, if not more. The problem I see is that if a school district is growing, it won’t add teachers until classes are overfull. From a cost-per-student perspective, this situation is beneficial. Conversely, the opposite is true. If a district is shrinking, it won’t cut teachers until classes are well under full. For example, if your target class size is 25, you might not consider adding a teacher until the actual number in the class passes 30 or so. If your school is large enough, you may need to reduce class sizes to 15-20 before combining classes.
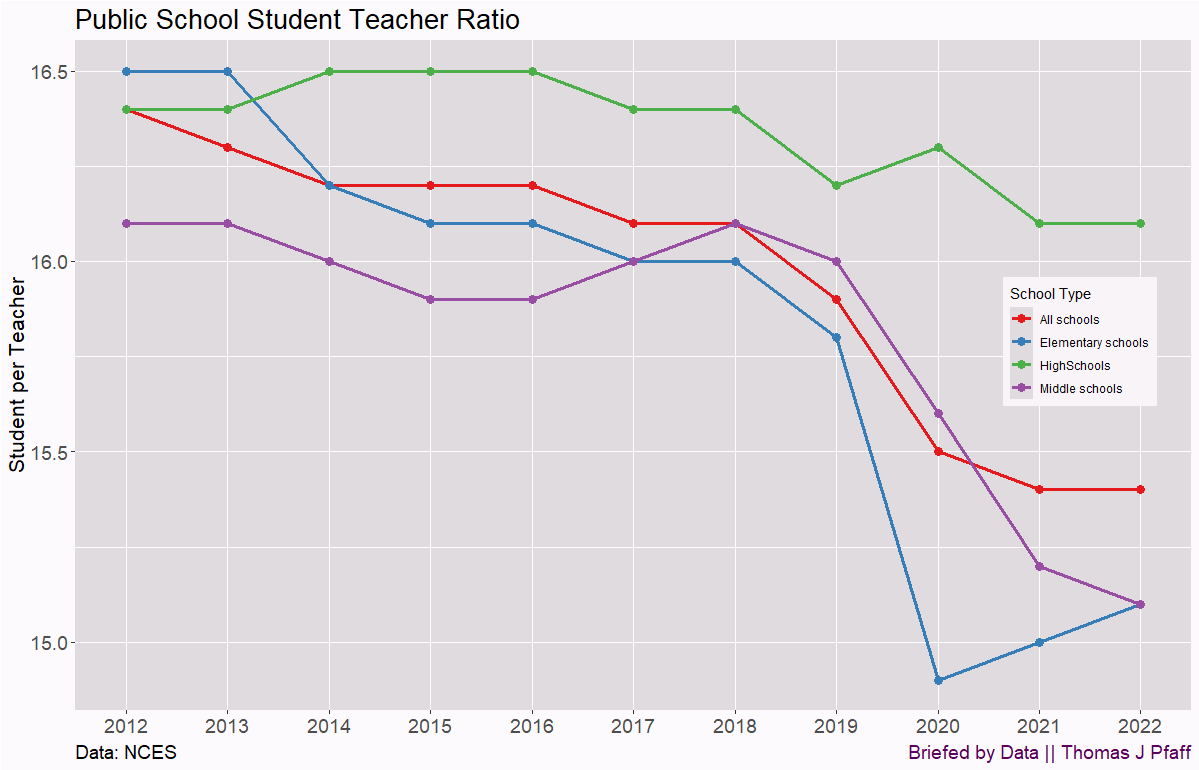
I’d argue that Figure 4 is evidence this is happening. Overall, the student-teacher ratio is dropping. High school has dropped less, partly because the student decline has affected it less. This dynamic partly explains this quote:
Despite the exodus, the DOE budget has ballooned nearly $7 billion since 2019 to $40 billion this year.
“Every year is the same story, New York City public schools keep losing students, their budget grows, the per-pupil funding grows and we get the same mediocre results. It is a system that is failing,” said parent and Manhattan Institute Fellow Danyela Souza Egorov.
Expect school budgets to continue increasing even though there are fewer students to educate.
To be fair to the article, they do give this stat:
Enrollment in publicly funded but independently run charter schools rose to 150,000 students last year, up 14% since 2019.
I’m uncertain if NCES counts charter schools as public since they are publicly funded. Even if not, this is still only part of the story of NYC enrollment declines.
Here is the table I promised above.
Please share and like
Sharing and liking posts attracts new readers and boosts algorithm performance. I appreciate everything you do to support Briefed by Data.
Comments
Please tell me if you believe I expressed something incorrectly or misinterpreted the data. I'd rather know the truth and understand the world than be correct. I welcome comments and disagreement. I encourage you to share article ideas, feedback, or any other thoughts at briefedbydata@substack.com.
Bio
I am a tenured mathematics professor at Ithaca College (PhD in Math: Stochastic Processes, MS in Applied Statistics, MS in Math, BS in Math, BS in Exercise Science), and I consider myself an accidental academic (opinions are my own). I'm a gardener, drummer, rower, runner, inline skater, 46er, and R user. I’ve written the textbooks “R for College Mathematics and Statistics” and “Applied Calculus with R.” I welcome any collaborations, and I’m open to job offers (a full vita is available on my faculty page).
Isn’t it striking how overall US public school enrollment is in decline, yet our nation’s capital sees extraordinary growth in population and school enrollment? The 937 SAT average of the class of 2024 is also a telling statistic. Is 800 still the minimum score? I understand they insist that every graduate must take the test.