RMI has another post that appears to be based more on hype than anything: The Race to the Top in Six Charts and Not Too Many Numbers - Cleantech competition between China, Europe, and the United States. (7/1/2024)
There is a global race to the top to lead the energy technologies of the future. As in past technology waves, the great powers are vying to reap the benefits of new technology ahead of their rivals and to export these technologies and expertise to the rest of the world.
The energy transition today is principally driven by three regions — China, Europe, and the United States — competing across three areas: cleantech supply chains, cleantech deployment (electric vehicles and renewables), and electrification. China currently leads in all three. Despite this lead, the race is still in its early stages, with Europe and the United States catching up, and other countries around the world joining in.
This all seems very exciting, but is it true? I want to focus on one particular graph, EV sales, and add a dose of skepticism. Here is the exposition and graph for Section 2 of the article:
All three regions are racing up the S-curves of deployment. When it comes to deployment, all three regions are racing up S-curves in the core clean technologies of solar, wind, and electric vehicles (EVs). But China is going the fastest. In 2023, China added more solar capacity and sold more electric vehicles in a single year than the United States has in 30 years.

I’ve already debunked the hype over solar and wind energy in The Green Energy Hype (6/25/2024) as well as in other posts, and so what about EVs? I’ll focus on China and the US. China increased it’s EV sales from around 1 million in 2020 to 8 million in 2023. Eight million seems like an awful lot of cars. Meanwhile, the US is up to about 1.75 million sales in 2023, and it doesn’t look like the US is racing up anything. Two data rules come to mind:
Trends need not continue.
Ask, Compared to what
Before we get to these rules, what is this S-Curve they speak of?
The S-Curve
You might know the S-Curve by one of its other names: logistic function. Figure 2 has two examples of this type of function, where I used percentage as the y-axis for this example.
The S-Curve is a sensible model for, for example, market penetration of a new technology. Consider smart phones. At first, very few people have them, and so the percentage of, say, adults with a smart phone is close to 0%. Growth is slow at first, but then market penetration speeds up (around time 13 for the dark purple and sometime after 25 for the lighter purple, in Figure 2, which does not actually represent smart phone sales). Eventually, market penetration slows as most people have a smart phone and only a handful of holdouts are left (around 25 for dark purple and 80 or so for the lighter purple). The y-axis value where the S-Curve levels out is called the carrying capacity. In the case of the market penetration of a good, this is at most 100% in the example given. The y-axis doesn’t have to be percentages.
Trends need not continue
The assumption in the RMI article is that EV sales are on this S-Curve trajectory, but this is still an open question. First, will EV sales become 100% of all sales. Maybe eventually? Do we have enough data to say for certain that we have started the “race” up the S-Curve? Maybe not. Here are two examples.
Figure 3 shows Germany’s cumulative installed solar power. In 2012, one might have said that solar power in Germany was “racing up” the S-Curve. In fact, that rate slowed down, and the growth in installed solar power didn’t get faster, as an S-Curve predicts, and in fact, it has yet to increase as fast as it did from 2010–2012.

For another example, Figure 4 shows Spain’s cumulative installed wind power. Should we have believed that Spain had reached it carrying capacity for wind power and that no more wind power would be installed? If you had, you would have been wrong.

The point here is that even if we believe that the US and China have started racing up the S-Curve in EV sales, we don’t know that it will continue. In fact, the US may have already stopped racing up the S-Curve (4/11/2024):
Electric vehicle (EV) sales growth in the U.S. continues to slow, according to sales data analyzed by Kelley Blue Book. In the first quarter of 2024, Americans bought 268,909 new electric vehicles, according to Kelley Blue Book counts. EV share of total new-vehicle sales in Q1 was 7.3%, a decrease from Q4 2023.
While annual EV sales continue to grow in the U.S. market, the growth rate has slowed notably. Sales in Q1 rose 2.6% year over year, but fell 15.2% compared to Q4 2023. The increase last quarter was well below the previous two years.
Ask, Compared to what
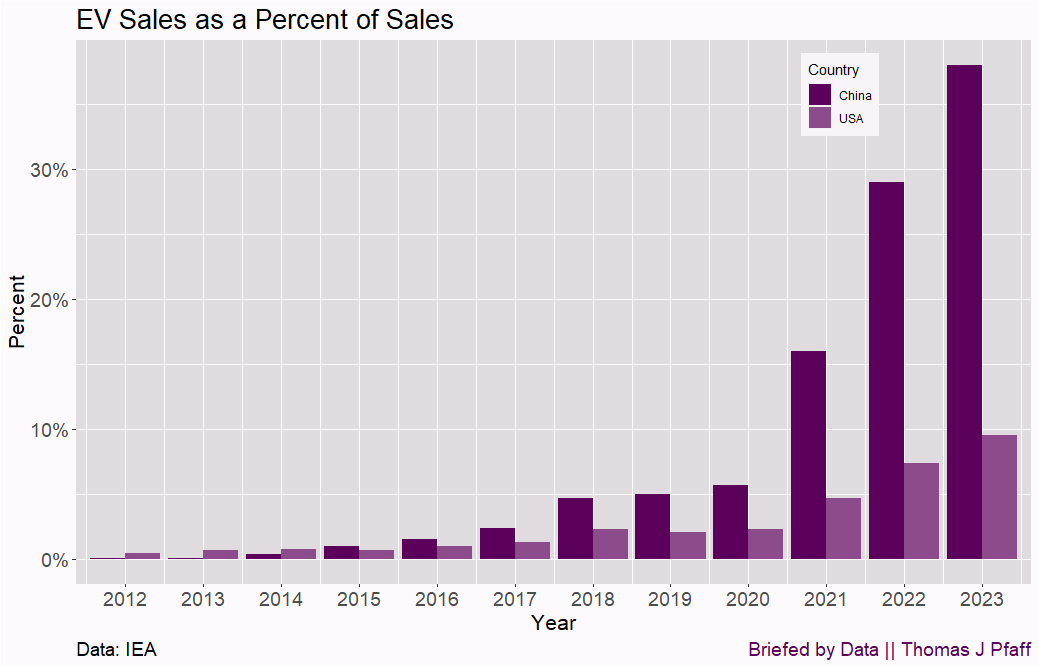
Eight million EV sales in a year, as China did in 2023 (Figure 1), lacks any context. For example, if the total car sales were 10 million, 80% of all car sales would be EVs. On the other hand, if 100 million cars were sold, then EVs would represent only 8% of all sales. We need to know the percentage of sales that were EVs. Figure 5 has this data.

China and the US are in very different places. EV sales in 2023 were almost 40% of all car sales for China and the growth as a percentage went from about 5% of all sales in 2020 to almost 40%. That’s impressive growth. Maybe they are racing up the S-Curve.
On the other hand, US EV sales haven’t surpassed 10% of all car sales, and the growth has only been about 2 percentage points per year over the last few years. The US isn’t racing up the S-Curve and growth since 2020 appears linear.
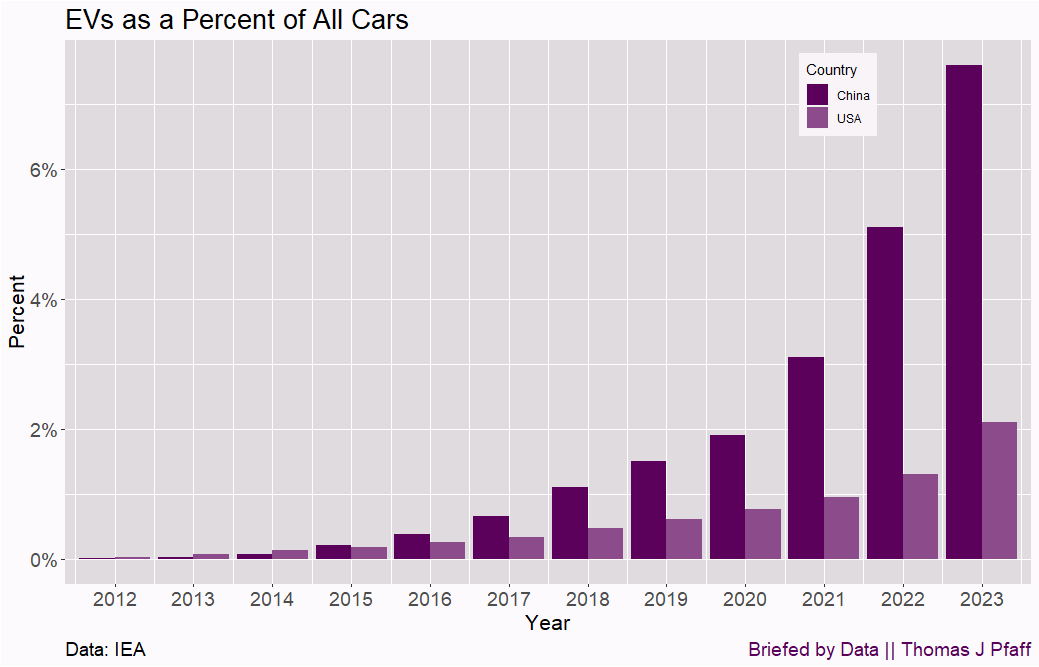
The second issue is comparing EVs to the overall car fleet. It takes time to turnover a car fleet. Where are China and the US in moving to an electric car fleet? Figure 6 has the answer.

China’s care fleet is still over 90% internal combustion engines (ICE), while the US is still 98% ICE cars. We are a long way from even a 50% EV fleet. As a back-of-the-envelope thought, consider the scenarios where 100% of cars sold in the US were electric. In the US, the average age of a car on the road is about 13 years, and if we take that to be close to the median (the median is likely a few years lower), it would take 13 years to get to a 50% EV fleet in the US. Of course, we aren’t close to 100% EV sales and are only at 10%. China has a much younger fleet, with an average age of about 5 years, and has the ability to dictate markets that don’t exist in the US. China may be able to turnover the fleet to EVs in a way the US can’t. We’ll see.
Verdict China might be racing up the S-Curve, but the US isn’t.
Final thoughts
My concern with publications like this one from RMI is their effect on distorting reality. For the US, the media will gladly buy this hype, and that then influences policy. If you believe that EVs are racing up the S-Curve then you can pat yourself on the back and do nothing. On the other hand, if you are more in touch with reality, then maybe you consider different policy decisions. For instance, instead of focusing on subsidies for EVs, maybe we should encourage more small ICE car sales. If the goal is to reduce CO2 emissions from cars, then moving to smaller cars helps, even if it isn’t the ideal solution on the left. At the same time, we should question whether or not EV subsidies are having much of an impact. Good policy starts with reality and facts, not with hype and hope.
Please share and like
Please help me find readers by forwarding this article to your friends (and even those who aren't your friends), sharing this post on social media, and clicking like. If you have any article ideas, feedback, or other views, please email me at briefedbydata@substack.com.
Thank you
In a crowded media market, it's hard to get people to read your work. I have a long way to go and I want to say thank you to everyone who has helped me find and attract subscribers.
Disagreeing and using comments
I'd rather know the truth and understand the world than always be right. I'm not writing to upset or antagonize anyone on purpose, though I guess that could happen. I welcome dissent and disagreement in the comments. We all should be forced to articulate our viewpoints and change our minds when we need to, but we should also know that we can respectfully disagree and move on. So, if you think something said is wrong or misrepresented, then please share your viewpoint in the comments.


