Grip strength, which is formally tested by gripping a dynamometer, is also a proxy measurement for upper body and total strength. Grip strength is one of the factors measured in the National Health and Nutrition Examination Survey (NHANES). The most recent data is from 2013–2014. There were 8,291 subjects. The sum of the right and left hands will be used to compare female and male grip strength. I removed from the data anyone who had hand or wrist surgery, as well as anyone who had arthritis or carpal tunnel syndrome. A person has to complete the test using both hands. This leaves us with 4,927 subjects, 2412 of whom are men and 2515 of whom are women. If we divide the data by decade of age and gender, we have at least 336 (males in their 70s; the maximum age is 80) and at most 476 (females in their 40s). The age distribution is comparable overall. Here's what we discover:
Overall male and female grip strength
Nobody is likely surprised that men are stronger than women, but they may underestimate how much stronger they are. The median summed female grip strength is 64% of the median summed male grip strength. Measures of central tendency do not tell the whole story, and we can see from the distribution that relatively few females exceed the male median. In fact, just 17 of the 2,515 females, or less than 0.1%, have a summed grip strength greater than the median summed grip strength of males.
Grip Strength by decade of age

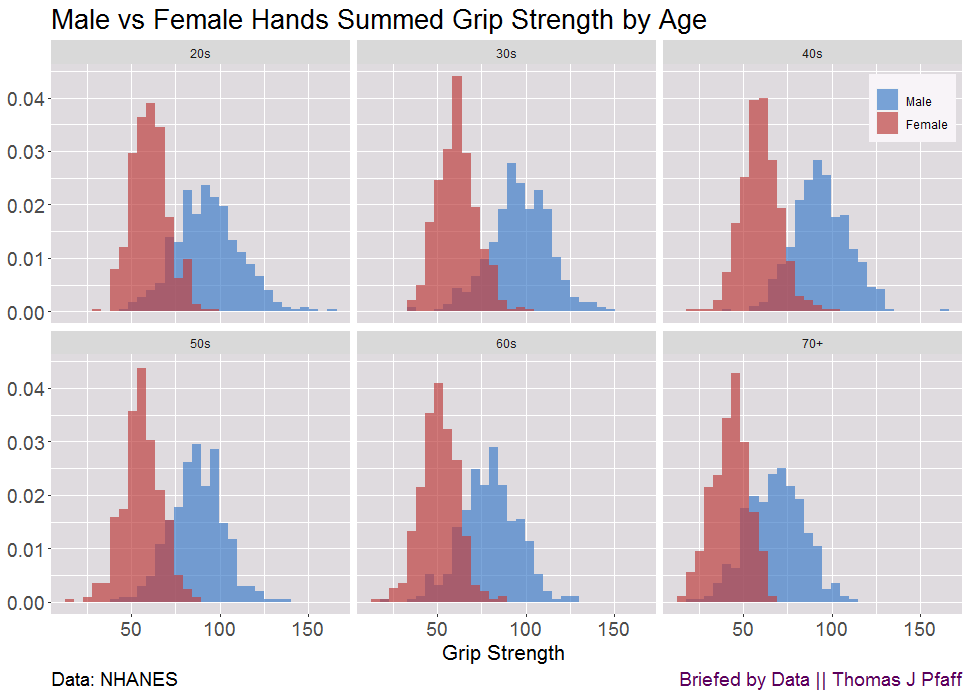
Figure 1 might raise the question of whether there was a difference in the age distribution, as strength declines with age. In fact, the first quartile, third quartile, and maximum ages for both men and women are the same. The median female age is 46, while the median male age is 47. Females have a mean age of 47.87, while males have a mean age of 48.08. Figure 2 depicts the total grip strength by decade of age. The summed grip strength of the groups decreases as they age. Nonetheless, the female vs. male contrast is essentially the same for each age group. In general, very few females outnumber males. Perhaps there is a reason why men are asked to open jars. When we look at these distributions, we may wonder how young and, hence, strongest females compare to older males.
Youngest females vs oldest males

When we compare the youngest females, ages 20 to 29, to males ages 70 to 80 (Figure 3), we notice that the gap has narrowed substantially, but the older males still have a greater summed grip strength, although the distributions are highly overlapping. A two-sample t-test with a p-value of 1.825x10^(-14) does show that the differences are statistically significant.
Why might this matter?
Overall, men are stronger than women, although the difference is bigger than we might imagine, as we might consider the case of a female who is stronger than the male. There are numerous examples of this in Figure 2 for each age cohort. Sports, on the other hand, attract individuals who are above average, and the more a sport requires strength, the more males will have a significant edge. This is seen at a young age in shorter-distance track events.
According to Table 1 of Duke Law School's Comparing Athletic Performances: The Best Elite Women to Boys and Men, high school boys under the age of 18 were faster than the best women in the 100, 200, 400, 800, 1500, 3000, and 5000 meter events. In reality, the number of boys who outperformed the fastest women in each of those events was 124+, 182, 285, 201+, 101+, 30, and 15, respectively. There are fewer males defeating the quickest women in the longer races, which demand more endurance than strength. In fact, the world record for boys aged 14 or 15 in the 1500m and shorter events is faster than the corresponding women's record. For example, the fastest 14-year-old boy time in the 200m is 20.89 seconds, whereas the fastest woman time is 21.34 seconds.
For distances ranging from 2000m to 10,000m, a 15- to 17-year-old boy's record is faster than a woman's record. Only in the marathon is the boys' record slower than the women's record. It takes a little longer because it is more about endurance and training than strength.
Please Share
Please help me find readers by forwarding this article to your friends (and even those who aren't your friends) and by sharing this post on social media. If you're on Twitter, you can find me at BriefedByData. If you have any article ideas, feedback, or other views, please email me at briefedbydata@substack.com.
Disagreeing and using comments
I'd rather know the truth and understand the world than always be right. I'm not writing to upset or antagonize anyone on purpose, though I guess that could happen. I welcome dissent and disagreement in the comments. We all should be forced to articulate our viewpoints and change our minds when we need to, but we should also know that we can respectfully disagree and move on. So, if you think something said is wrong or misrepresented, then please share your viewpoint in the comments.


Would this be an accurate 'explain like I'm 5 version' of the data: pick a middle aged man at random and he will probably be stronger than the vast majority of women?
What is the unit on the Y axis? I know it is individuals, but is it thousands? Tens of thousands?