

Population changes by state
TX is still growing, CA less so
In the post Enrollment Changes in 12th Grade by State (12/16/2025), I provided a tile grid map showing 12th grade enrollment by each state, while two weeks ago in my QTRS post there was a graph of population changes for selected cities. These posts, along with comments about different fertility rates for conservatives and liberals, got me curious about overall population changes in each state. Hence, today you get tile grid maps that show changes in state populations.
The data today comes from the GitHub site JoshData, although it was originally compiled from FRED. For Cook’s Partisan Voting Index (PVI), I simply used Wikipedia.
Figure 1 shows the population in each state starting in 1900 through 2025. Note that you can click on the graph to make it larger and easier to read.
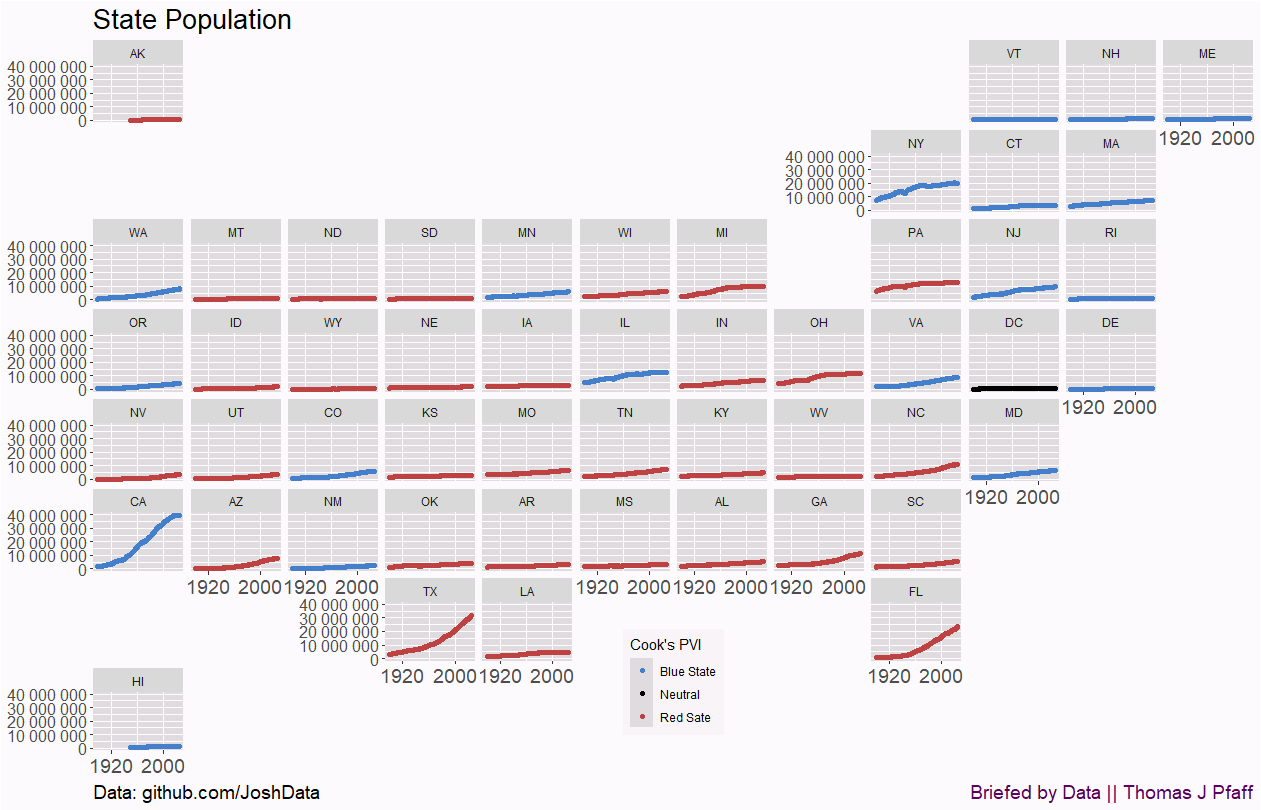
It really is striking how much more populated CA, TX, and, to some extent, FL are than all the other states. The only difference is that California is not growing, while Texas and Florida are. The next biggest blue state, NY, also isn’t growing.
Given the size difference between states, it helps to look at the data differently. Hence, Figure 2, which is the yearly percentage change in population.
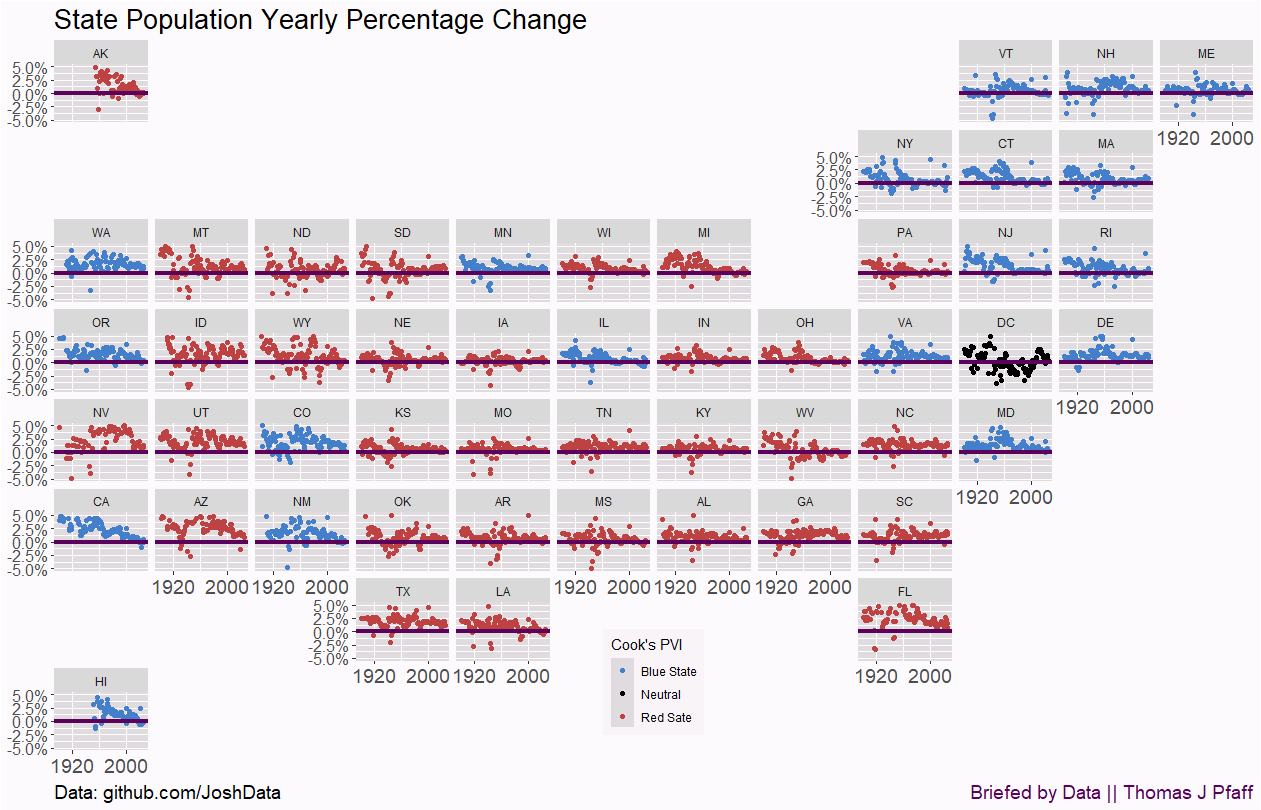
CA population growth has been slowing for decades to where it is essentially zero now. Similarly, New England states are seeing little to no growth. Meanwhile, positive growth rates continue in TX and FL.
All this makes me wonder if the immigration divide would be reversed if the growth rates in the big blue and red states were reversed. If immigration is an important driver to maintain population growth or even to avoid population decline, a state may be more inclined to support a more open border policy. A robust population growth from births and domestic migration may lead to resistance against a large immigrant population due to increased strain on systems. All of this speculation is conjecture on my part. What are your thoughts on this scenario and, in general (12/16/2025), the data presented here? Please share your thoughts in the comments.
Please share and like
Sharing and liking posts attracts new readers and boosts algorithm performance. I appreciate everything you do to support Briefed by Data.
Comments
Please tell me if you believe I expressed something incorrectly or misinterpreted the data. I'd rather know the truth and understand the world than be correct. I welcome comments and disagreement. I encourage you to share article ideas, feedback, or any other thoughts at briefedbydata@substack.com.
Bio
I am a tenured mathematics professor at Ithaca College (PhD in Math: Stochastic Processes, MS in Applied Statistics, MS in Math, BS in Math, BS in Exercise Science), and I consider myself an accidental academic (opinions are my own). I'm a gardener, drummer, rower, runner, inline skater, 46er, and R user. I’ve written the textbooks “R for College Mathematics and Statistics” and “Applied Calculus with R.” I welcome any collaborations, and I’m open to job offers (a full vita is available on my faculty page).
How much of the difference in population growth has been driven by inter-state migration and how much has been driven by different realized fertility?
You keyed on one subtext for the "blue" states' increasing preference for permissive immigration policy: countering the population stagnation. Another is that team "blue" overtly caters to the college-educated, affluent, professional-managerial class, which appears to be increasingly invested in an economy of house cleaners, food delivery people, childcare workers, et al, which in turn only works if there is cheap labor around.
Hmm. My head went immediately to the environmental aspects of life in Florida or Texas or California. Each state has, notably, had its recent share of 'natural disasters' -- flooding, hurricanes, wildfires and arson fires that exploded. Texas had its debacles with energy / electricity grid and massive increases to people's bills. What are the bigger impacts of the population growth in these states...? Also thinking about Census tract level growth, like in urban, sub-urban, and ex-urban areas, such as Phoenix, Tucson, the Research Triangle, Atlanta, etc.