


QTRS August 22, 2024
Interesting content for the curious with lots of graphs

U.S. Oil production
From the AEI article Joe Biden Is the “Drill, Baby, Drill” President (8/9/2024)

The point here is that it really doesn’t matter which team has the presidency. We want and need oil and any president who tries to cut our oil production risks economic problems, which would threaten reelection.
Gas taxes
I had couple of nice comments related to Tuesday’s post: Does more renewable electricity reduce prices? I do want to know what is driving these differences in electricity cost. I replied to one of the comments that taxes could be one of the factors. Related to this, the eia article Average state tax rates for retail gasoline and diesel fuel flat since January 2024 (8/20/2024) has this graph.
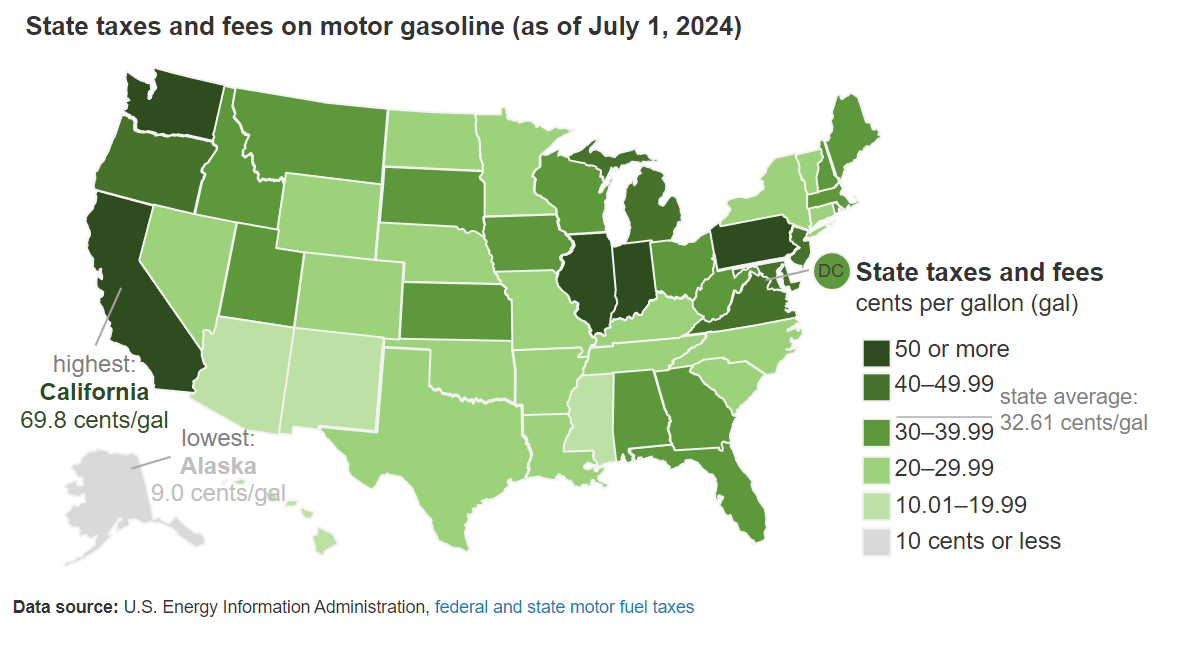
Now, this is about gas and not electricity but maybe it is a reasonable proxy. California has the highest gas taxes and maybe they also have high electricity taxes. Either way, there is considerable variability by state for gas taxes and so it is reasonable to assume that there may be a lot of variability in electricity taxes.
Graph of the week
This comes from the article Global biogeographic regions for ants have complex relationships with those for plants and tetrapods (7/5/2024)
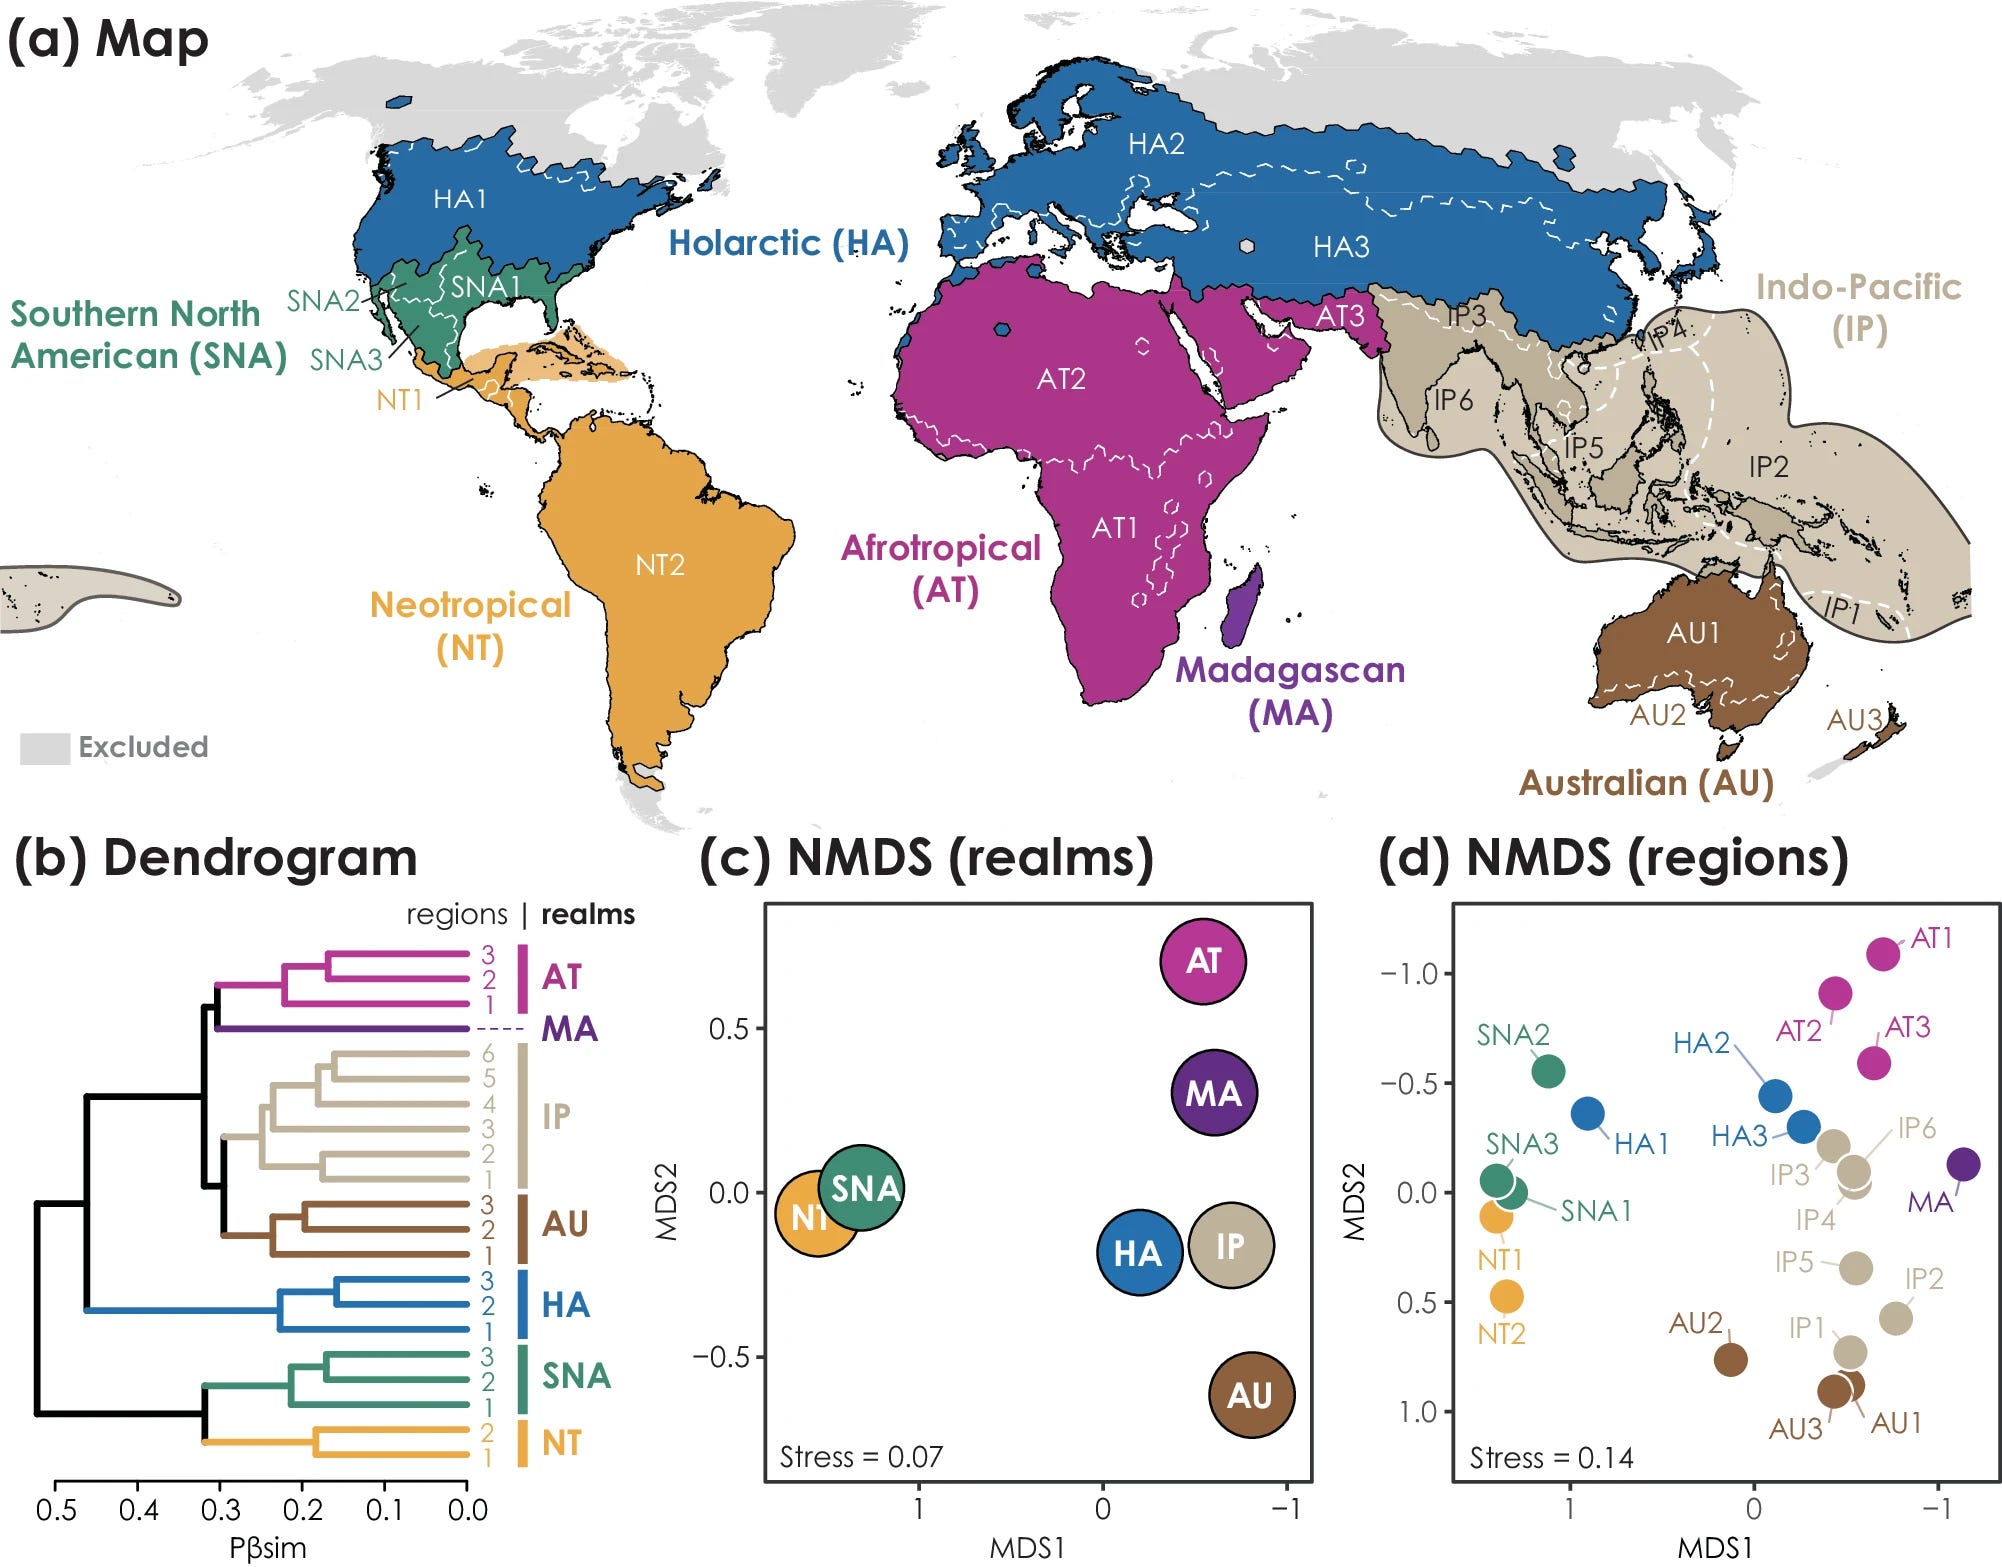
Caption: (Phylogenetic: relating to the evolutionary development and diversification of a species or group of organisms, or of a particular feature of an organism.
Ant biogeographic realms and regions of the world are shown in a, and the associated dendrogram resulting from hierarchical clustering based on phylogenetic turnover (Pβsim) across 5 × 10⁴ km2 hexagons is shown in b. Ordination results using nonmetric multidimensional scaling (NMDS) show relationships among realms in c and regions in d. Black solid lines and white lines (dashed on the ocean) delineate the borders of realms and regions, respectively. Colors used to characterize particular realms in maps correspond to those in dendrogram and ordination plots. Areas without sufficient data or invalid biogeographic units are indicated in gray. The map in a is in the Robinson projection system, and the dendrogram in b used the unweighted pair-group method using arithmetic average (UPGMA).
It is an interesting paper with more neat graphs.
From the gardens
The last picture shows the current size of the few paw-paws we have for the first time this year.


This is why data centers matter
This is from the IMF post, Carbon Emissions from AI and Crypto Are Surging and Tax Policy Can Help (8/15/2024). They are projecting that in only a couple of years, crypto and data centers will use 2–6% of the world's electricity.

Adding to this, is Running 2,000 Nvidia AI GPUs costs $2m in electricity costs annually in Texas. (8/21/2024)
According to Liftr's data covering semiconductors and power usage in Texas, using 2,000 Nvidia cards - worth around $33 million in AI accelerator components - could see power bills reaching $2 million in Dallas.
This cluster would have a compute performance in excess of 44.7 FP64 petaflops.
AI, data storage, and computing are going to continue to run up the electricity bills. If you want to stop climate change, you have to deal with this.
Electricity-generating capacity
The eia, U.S. power grid added 20.2 GW of generating capacity in the first half of 2024 (8/19/2024), which has a strange definition of generating capacity.

Did you find it? Battery storage isn’t a generating capacity. One of the other sources has to charge the batteries, and like all batteries, they have a limited life before needing to be recharged. The planned additions have 2.6 gigawatts for natural gas, but that isn’t important by itself because we could conclude that although we are adding more wind and solar, we are still adding natural gas. We need to also look at their graph of retirements.

There is net loss of natural gas capacity of 1.2 gigawatts as well as retirement of petroleum and coal capacity. In the end, this will be a year where we add wind and solar while subtracting fossil fuel capacity.
How hot was July 2024?
Here is what NASA has to say:
July 2024 was the warmest July on record for the globe in NOAA's 175-year record. The July global surface temperature was 1.21°C (2.18°F) above the 20th-century average of 15.8°C (60.4°F). This is 0.03°C (0.05°F) warmer than the previous July record set last year, and the 14th consecutive month of record-high global temperatures. This breaks the longest record warm global temperature streak in the modern record (since 1980) previously set from May 2015—May 2016. July 2024 marked the 48th consecutive July with global temperatures, at least nominally, above the 20th-century average.
Climatologically, July is the warmest month of the year. As the warmest July on record, July 2024 was more likely than not the warmest month on record for the globe since 1850. The past ten Julys have been the warmest Julys on record.
As you can see, July was a record anomaly for July, but barely as we move from El Niño to neutral status.

But, when we look at all months, we can see that the last black bar, July 2024, is more in line with the recent neutral status anomalies. At the same time, we don’t see news stories about record anomalies and we may not for approximately 5 year. I think the way the media reports this hurts the cause of climate change. Five years is a long time to not talk about record temperatures, which leaves people believing the problem is over or worse, that the media just cries wolf every so often. If you don’t understand the pattern, it is hard to report temperature anomalies accurately.

The spinning CD
Please share and like
Sharing and liking posts attracts new readers and boosts algorithm performance. Everything you do is appreciated.
Comments
Please point out if you think something was expressed wrongly or misinterpreted. I'd rather know the truth and understand the world than be correct. I welcome comments and disagreement. We should all be forced to express our opinions and change our minds, but we should also know how to respectfully disagree and move on. Send me article ideas, feedback, or other thoughts at briefedbydata@substack.com.
Bio
I am a tenured mathematics professor at Ithaca College (PhD Math: Stochastic Processes, MS Applied Statistics, MS Math, BS Math, BS Exercise Science), and I consider myself an accidental academic (opinions are my own). I'm a gardener, drummer, rower, runner, inline skater, 46er, and R user. I’ve written the textbooks R for College Mathematics and Statistics and Applied Calculus with R. I welcome any collaboration.