Classroom connections for March 2, 2024
Links to data and examples of math and statistics applications
Classroom connections are less something you can apply right away and more of me pointing out resources. I believe that there is a lot of amazing math, statistics, and data out there that might be used in math classrooms and is also interesting to the curious. Some of these examples may require some effort to be classroom-ready, and some of this has appeared in previous posts. I’m ordering this roughly based on the level of math. Please let me know if you or someone you know uses any of this in the classroom or has a relevant idea (email me at thomas.pfaff@sustainabilitymath.org). Really, leave a comment or send me an email if these classroom connection posts are useful. Similarly, if you have an opinion or concept that is relevant, please share it in the comments. Please share, like, subscribe, and feel free to comment.
This one won’t fit in your email, so you’ll have to open it to get to clustering, PCA, and some other more advanced applications.
Scavenger hunt
From Scavenger Hunt: Where Is Gina the Geographer?
Gina the Geographer has escaped to a secret location. It’s your mission to find her and bring her back to school! Put your geography skills to the test and use these census data-powered clues about landmarks, weather, population, and more to figure out where Gina’s hiding.
I’m not sure if this one would be useful in a math or statistics class or not, but the idea might be copied as a task for a math or statistics class. Basically, an online data-scavenger hunt might be a useful assignment.
Basic math
I used this eia graph in the Feb 22 Quick takes. As a project, convert all routes into a cost estimate per route.
Snow water equivalent
The Snow Water Equivalent in Western Basins - Interactive Graphs page explains how to use the snow water data base and links to a map where the user can choose a site and get both a graph like the one below and the related data. These seem useful for a statistics, data science, quantitative literacy, or sustainability class.
Normal Distribution
There is an example of the normal distribution used to model out production in my post Peak oil and U.S. oil production. The post includes Hubbert’s original graph and current example. Oil data can be found under Statistics Projects on my other website.
Climate modeling: Maximum and minimum temperature changes
In Reversed asymmetric warming of sub-diurnal temperature over land during recent decades (11/8/2024), they look at whether the difference between daily maximum temperature and daily minimum temperature is increasing or decreasing. With a little effort, you can find local data and see how you compare. The paper does provide information on how to get their data.
Integration in the wild
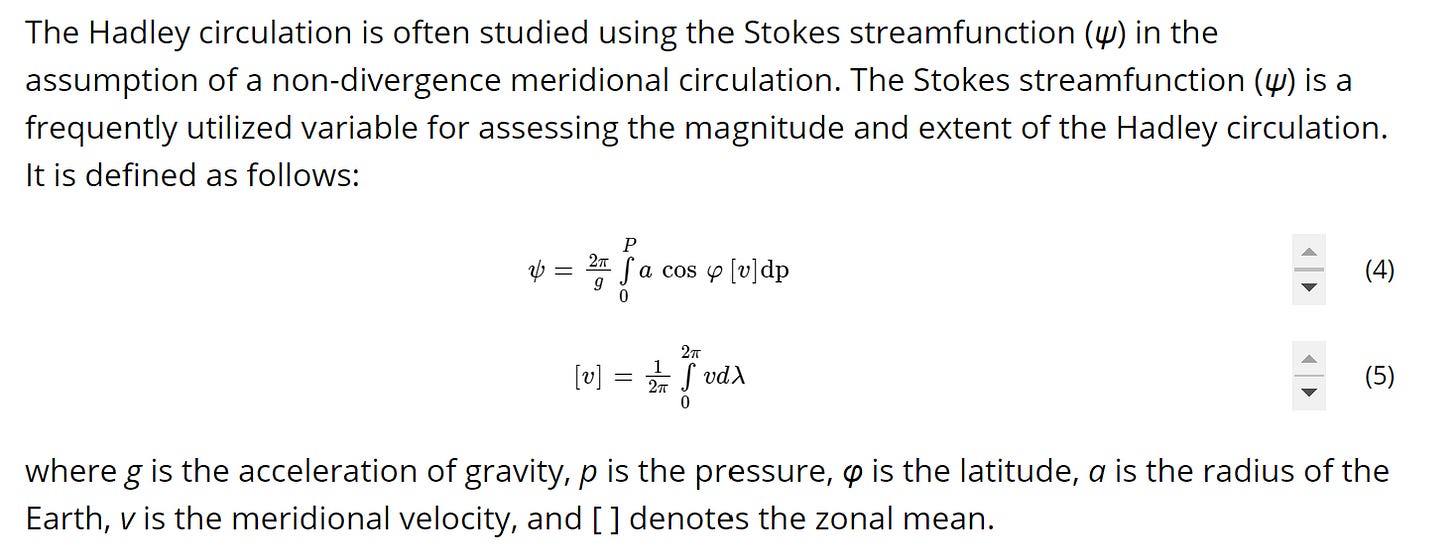
The math is probably more than can be used in the paper The Projected Poleward Shift of Tropical Cyclogenesis at a Global Scale Under Climate Change in MRI-AGCM3.2H (1/3/2024), but sometimes it is nice to show students that calculus is used.
Graph Theory
Again, probably more than can be used, but this is an example of graphs being used in applications: From populations to networks: Relating diversity indices and frustration in signed graphs (2/3/2024)
Metastatistical Extreme Value (MEV) distribution
From the abstract of Frequency Rather Than Intensity Drives Projected Changes of Rainfall Events in Brazil (1/25/2024)
Extreme rainfall events are expected to intensify with global warming, posing significant challenges to both human and natural environments. Despite the importance of such assessments, they are unevenly widespread across the globe. Here, using bias corrected climate simulations of the latest phase of the Coupled Model Intercomparison Project (CMIP6), we provide a comprehensive assessment on how different rainfall events are expected to change across Brazil.
The paper could be a good independent study project or just show examples of different distributions used in applications. The paper has a link to the data at the bottom.

Logistic and PCA
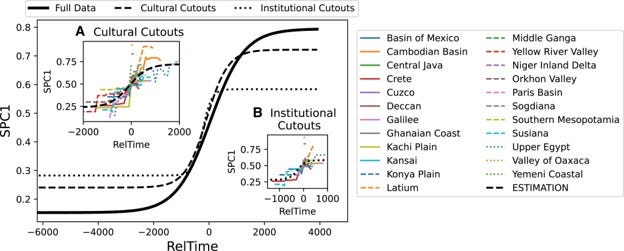
I used this in the Feb 15 Quick takes. There are links to the data at the bottom. From the paper’s statement of significance:
Do human societies experience cultural evolution on similar time scales? Here, we analyze the Seshat: Global History Databank, which contains quantified historical and archaeological information from a global sample of societies around the world from the last 10,000 years. The first principle component SPC1 summarizes the variation in social complexity, and we show that a universal logistic growth model can be fitted to the SPC1 time series. This model implies the existence of a period of growing social complexity lasting about 2,500 years, with relatively minor changes before or after. These results provide new empirical support to ideas that there are common pathways in human social evolution across past cultures.
PCA
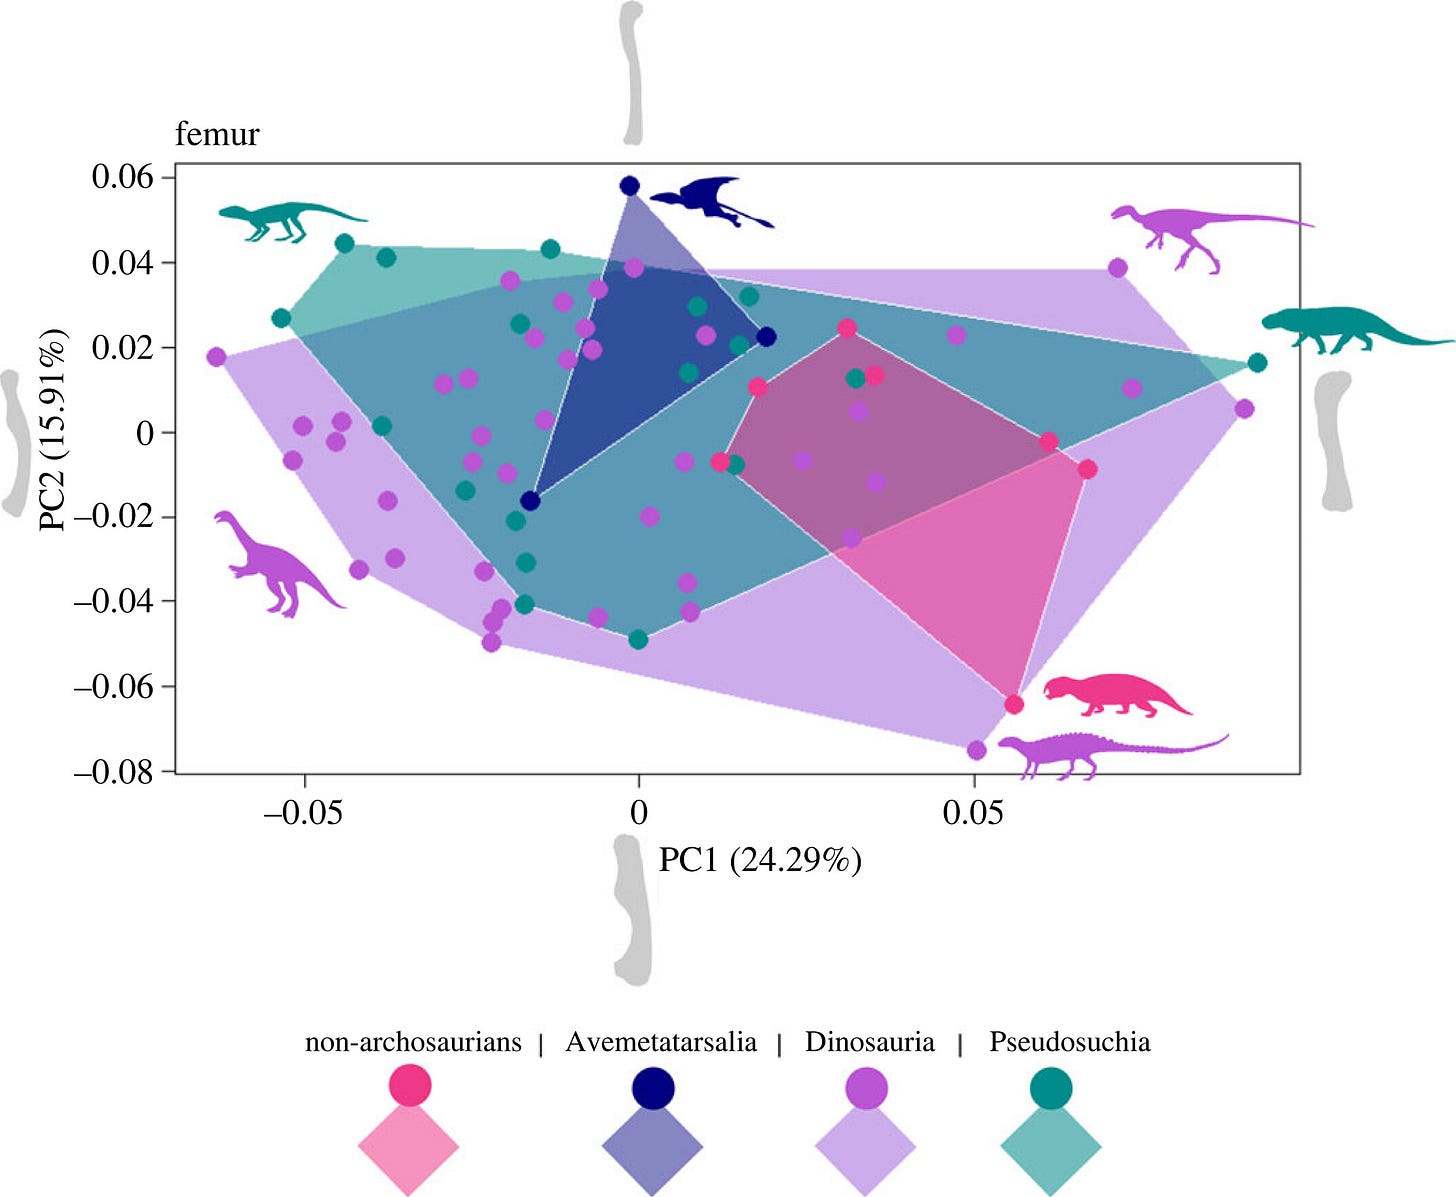
If you need PCA data, you can find some in Locomotion and the early Mesozoic success of Archosauromorpha (2/7/2024)
Cluster
Data for hierarchal clusters and more are presented in the paper Comparative genomics reveals the dynamics of chromosome evolution in Lepidoptera (1/21/2024).
Stochastic DE
If you need a challenge that includes a stochastic differential equation, look at Warning of a forthcoming collapse of the Atlantic meridional overturning circulation. (7/25/2023)


